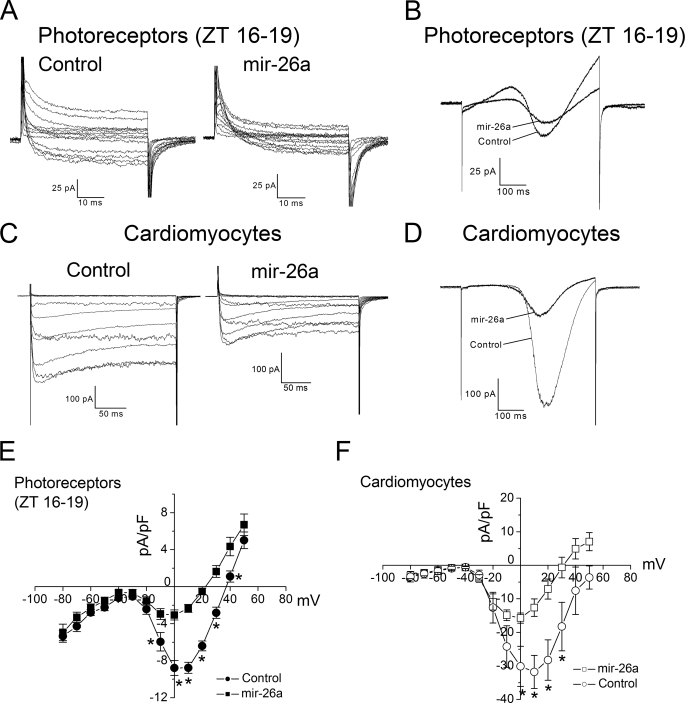
FIGURE 3.
gga-mir-26a repressed L-VGCC current amplitudes. Photoreceptors (A, B, and E) or cardiomyocytes (C, D, and F) were co-transfected with eGFP and either the empty vector (control) or gga-mir-26a. A, B, and E, after 24 h in DD, perforated patch recordings were performed on photoreceptors only at night (ZT 16–19). Two representative recordings from photoreceptors transfected with empty vector (control) or gga-mir-26a (A and B). A, cells were held at −65 mV, and step commands were given from −60 to +50 mV at 10-mV intervals in 50 ms. B, a ramp command was given from −80 to +60 mV over 500 ms. E, the average current density (pA/pF)-voltage (mV) relationship obtained from step commands of control (solid circle) or gga-mir-26a (solid square) transfected photoreceptors were plotted. n = 9 for the control, and n = 8 for mir-26a; *, p < 0.05 in Student's t test. Whole cell patch recordings from two representative cardiomyocytes were transfected with empty vector (control) or gga-mir-26a (C and D). C, cells were held at −65 mV, and step commands were given from −60 to +50 mV at 10-mV intervals in 200 ms. D, a ramp command was given from −80 to +60 mV over 500 ms. F, the average current density (pA/pF)-voltage (mV) relationship of control (open circle) or mir-26a (open square) transfected cardiomyocytes was plotted. n = 8 for both control and mir-26a groups; *, p < 0.05 in Student's t test.

