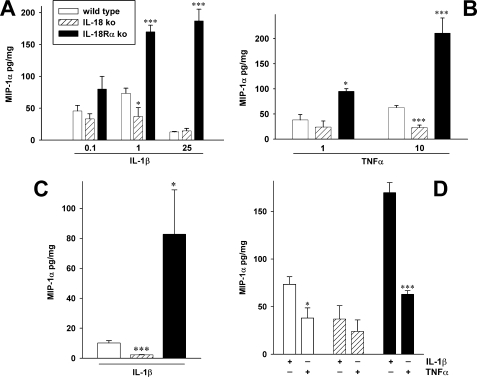
FIGURE 2.
Production of MIP-1α in IL-1β- and TNFα-stimulated MEF cells. WT, IL-18 ko, and IL-18Rα ko MEF cells were stimulated with the indicated concentrations of either IL-1β or TNFα, and after 20 h (A, B, and D) or 6 h (C; 25 ng/ml IL-1β), the levels of MIP-1α were measured in the supernatants. Results represent MIP-1α in pg/mg total protein in IL-1β-exposed (A, C, and D) or TNFα-exposed (B and D) cells. The data are means ± S.E. of four independent experiments, each experiment performed on a separate cell line derived from a different mother (see Table 1). A–C, *, p < 0.05; ***, p < 0.001 compared with the values in WT cells. D, comparison of IL-1β (1 ng/ml) with TNFα (10 ng/ml) as stimuli of MEF cells. Data are means ± S.E. (n = 4); *, p < 0.05; ***, p < 0.001 for IL-1β- compared with TNFα-stimulated MEF.

