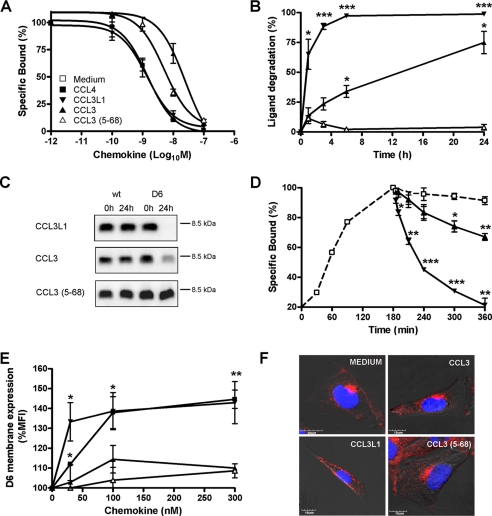
FIGURE 4.
D6 exhibits similar binding but different scavenging activities for CCL3L1, CCL3, and CCL3(5–68). A, competitive binding. CHO-K1/hD6 cells were incubated with 125I-hCCL4 and the indicated concentrations of unlabeled human CCL4 (■), CCL3L1 (▼), CCL3 (▲), and CCL3(5–68) ( ). B, scavenging assay. CHO-K1/hD6 cells were incubated with 1.2 nm CCL3L1 (▼), CCL3 (▲), and CCL3(5–68) (
 ) at 37 °C for the indicated periods. Results are indicated as 100 minus the percentage of intact chemokine, measured by ELISA test. C, supernatants derived from CHO-K1 and CHO-K1/hD6 transfectants incubated for 24 h with CCL3L1, CCL3, and CCL3(5–68) were analyzed by SDS-PAGE and Western blot. D, 125I-CCL4 dissociation curves. D6 transfectants were incubated for 3 h at 4 °C with 50 pm 125I-labeled CCL4; then the supernatant was removed and replaced by 100 nm CCL3L1 (▼), CCL3 (▲), CCL3(5–68) (
 ), or medium (□) for increasing periods. Results are expressed as 100 minus the percentage of radioligand remaining cell-associated. E, D6 membrane up-regulation. CHO-K1/hD6 cells were incubated at 37 °C for 1 h with increasing doses of indicated chemokines and then labeled for FACS analysis with anti-D6-PE antibody. F, confocal images of immunofluorescence-stained CHO-K1/D6 cells. Shown is double staining of D6 (red) with 4′,6-diamidino-2-phenylindole (blue) after stimulation with the indicated chemokines (100 nm, 30 min). Results shown in A, B, D, and E are the mean ± S.E. of at least three independent experiments performed. Results shown in C and F are representative experiments of at least three performed *, p < 0.05; **, p < 0.005; ***, p < 0.0005, chemokine versus medium-treated CHO-K1/D6 transfectants.

