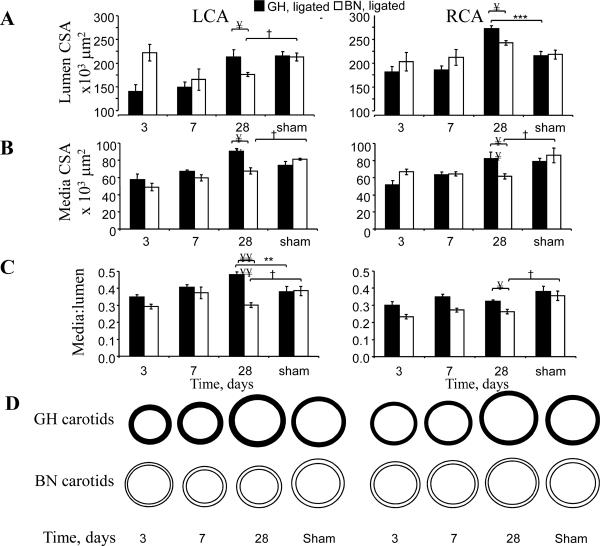
Figure 2. Histomorphometric analyses of LCA and RCA.
A. Lumen cross sectional area (CSA). B. Media CSA. C. Media/lumen ratios. D. Schematic representation of remodeling data. Note all data from paraffin embedded and formalin fixed sections. Analysis used 2-way ANOVA (factors rat strain and intervention) followed by Fisher's post-hoc tests for the 28 day data points, as described.

