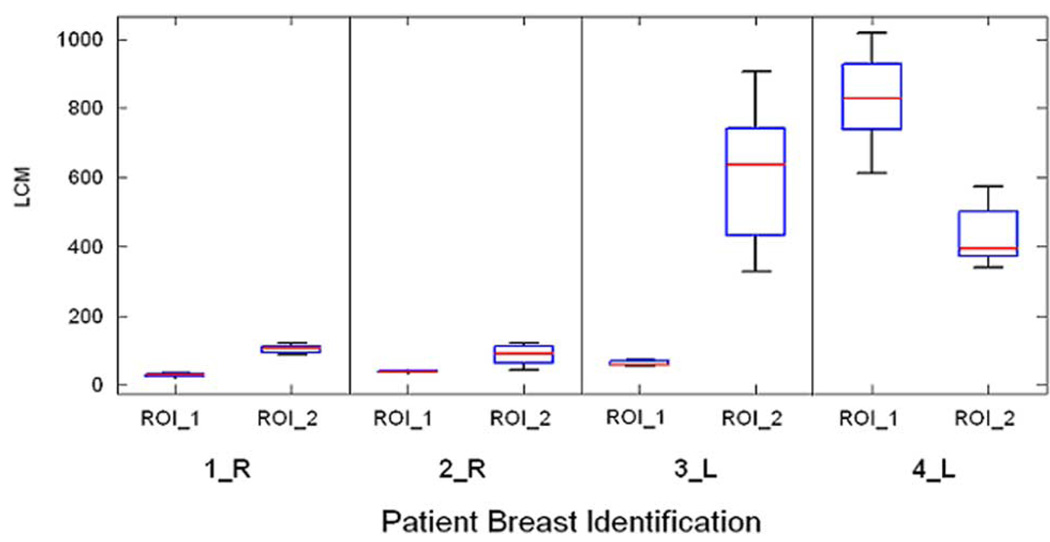
Fig. 7.
The distributions of the LCM for the regions of interest identified in Fig. 4. Note the LCM values are much larger for voxels associated with the malignant lesions. ROI_1 refers to region associated with the EIS plots at the top of Fig. 4 while ROI_2 refers to the region associated with those on the bottom.

