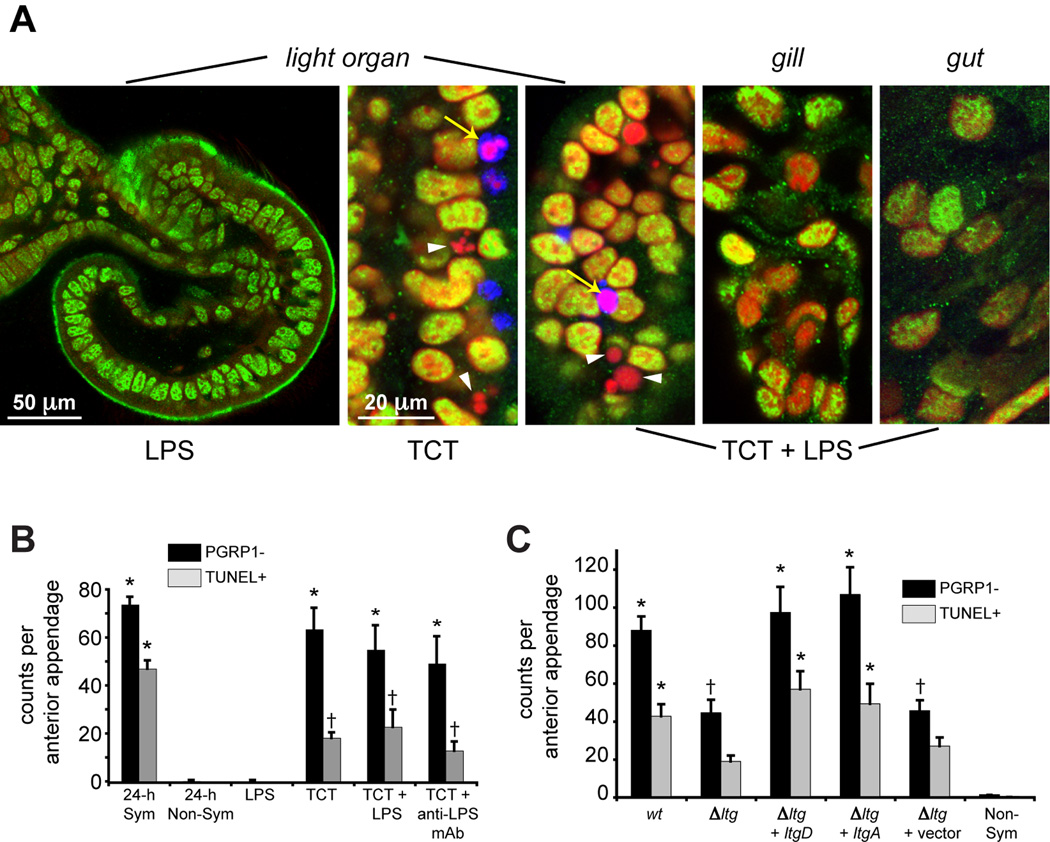
Figure 6. TCT induction of EsPGRP1 loss and late-stage apoptosis.
A) Representative confocal micrographs of E. scolopes epithelia. Hatchling E. scolopes were exposed to 10 ng/ml LPS and/or 10 µM TCT and assayed for EsPGRP1-negative and TUNEL-positive nuclei at 24 h. TCT induces EsPGRP1-negative (white arrowheads) and TUNEL-positive (yellow arrows) nuclei. EsPGRP1, green; DNA, red; TUNEL, blue. B) Direct-count estimates of EsPGRP-negative and TUNEL-positive nuclei in TCT/LPS treated light organs (n = 10). Symbols represent groupings that are statistically different from other groups. C) Direct-count estimates of EsPGRP1-negative and TUNEL-positive nuclei in light organs colonized by V. fischeri mutants defective in TCT secretion. Δltg represents mutant strain DMA388, which is defective for three lytic transglycosylases (ΔltgA, Δ ltgD, ltgY::erm). Complementation strains carry indicated gene on the plasmid pVSV107 (Dunn et al., 2006). Symbols represent groupings that are statistically different from non-symbiotic light organs († represents an intermediate level of EsPGRP1 loss that is different from both sym and non-sym). For both B and C, Statistical analysis included ANOVA with Tukey’s pairwise comparisons to identify statistically significant differences between time points (group error rate p ≤ 0.05). Error bars represent standard error.

