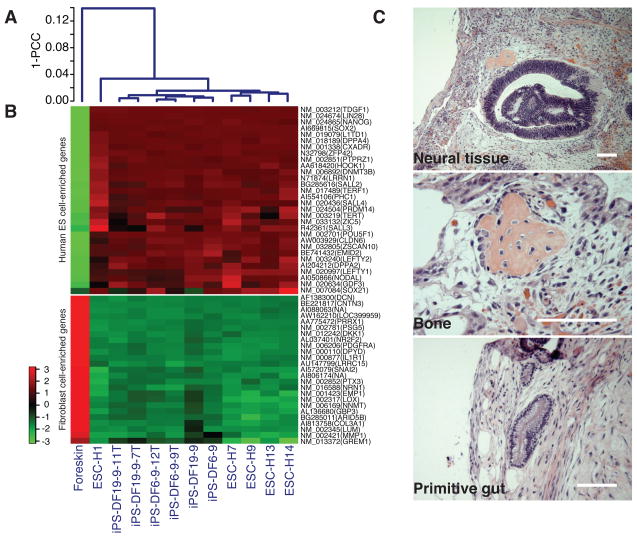
Fig. 4.
Characterization of iPS cell subclones. (A) Pearson correlation analyses of global gene expression (51,337 transcripts) in iPS cell parental clone DF6-9 and DF19-9; iPS cell subclone DF6-9-9T, DF6-9-12T, DF19-9-7T, and DF19-9-11T; five human ES cell lines; foreskin fibroblasts. 1-PCC: Pearson Correlation Coefficient. (B) Expression of genes that are differentially expressed between human ES cells and foreskin fibroblasts. Top panel: 30 well-known human ES cell-enriched genes; bottom panel: top 25 foreskin fibroblast-enriched genes. The color key is shown on the left. (C) Hematoxylin and eosin staining of teratoma sections of iPS-DF19-9-11T (7 weeks after injection). Teratomas were obtained from all four iPS cell subclones. Scale bars, 0.1 mm.

