
Fig. 3.
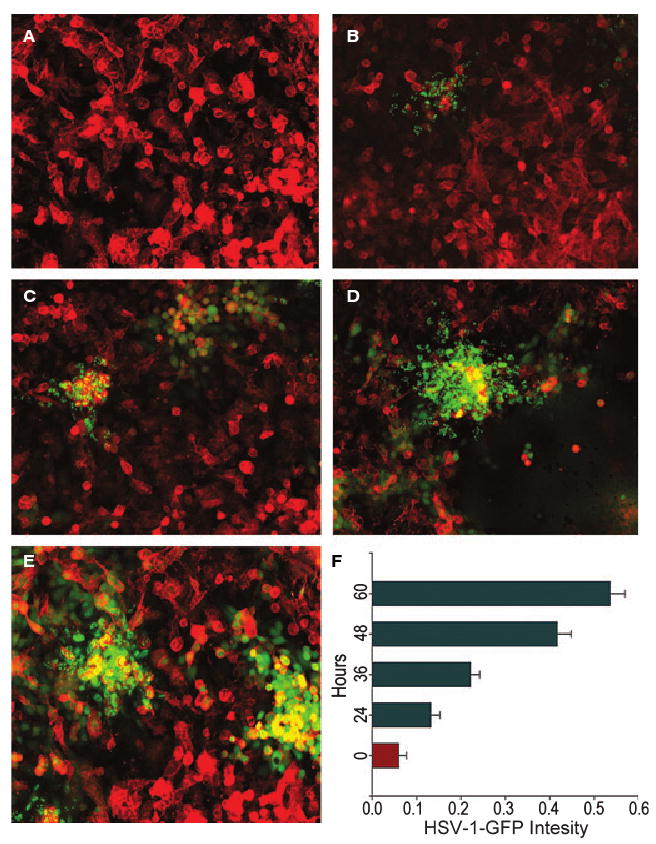
Imaging and quantification of HSV-1 replication in cultured RPE cells. Confluent monolayers of RPE cells were infected with K26GFP and the viral replication was imaged at (A) 0 h, (B) 24 h, (C) 36 h, (D) 48 h and (E) 60 h postinfection. In parallel, the same pools of cells were quantified for the increase in fluorescence intensity using a spectrophotometer (F). The GFP intensity increased exponentially over time, as seen in (A–E) and in graphical form in (F). The images were taken with a Zeiss Axiovert 100 microscope. Error bars represent standard deviations.