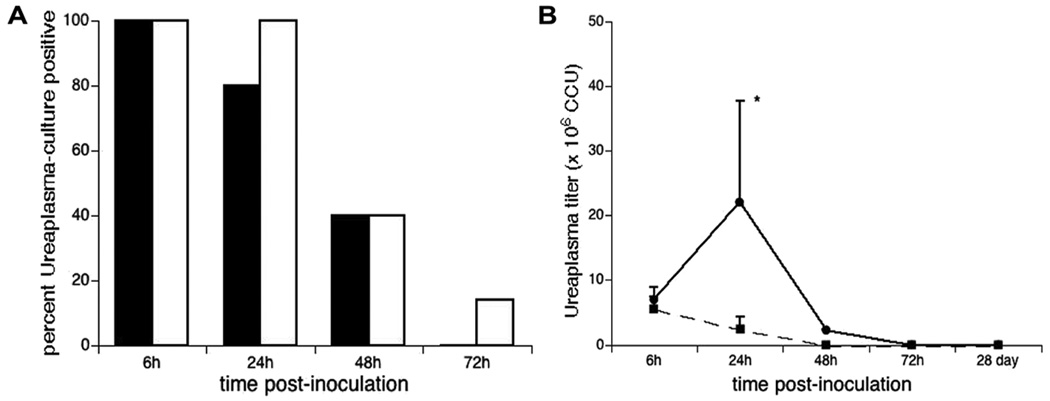
Figure 5. Percent of WT and SP-A−/− mice culture-positive post-Ureaplasma inoculation (A) and lung homogenate titers (CCU) (B).
Lungs of Ureaplasma-inoculated mice were homogenized and cultured in 10B broth. Data are expressed as the percentages of animals that were Ureaplasma positive by culture and confirmed by PCR in WT (black bar) and SP-A−/− mice (white bars) at each day post-inoculation. *p<0.05 vs WT at 24h and all other time points both strains.

