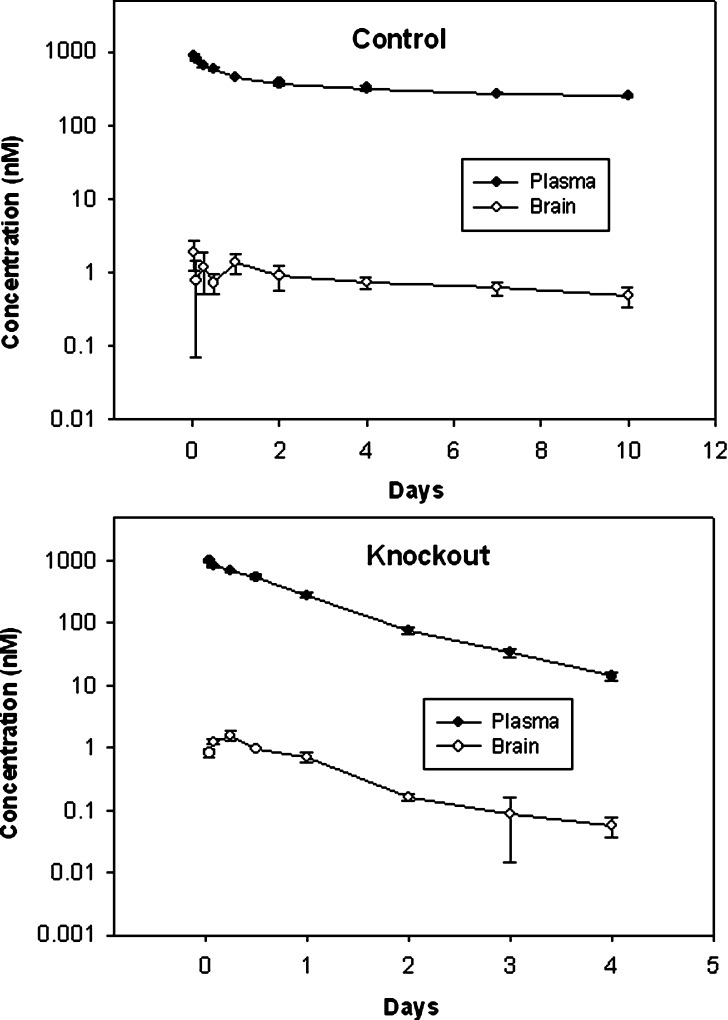
Fig. 1.
Plasma and brain disposition of 7E3. Plasma concentration vs. time profiles and brain concentration vs. time profiles 7E3 are shown for control and FcRn-deficient mice. Brain concentrations were corrected for residual blood content, as described in the text. Error bars indicate the standard deviation associated with each mean concentration

