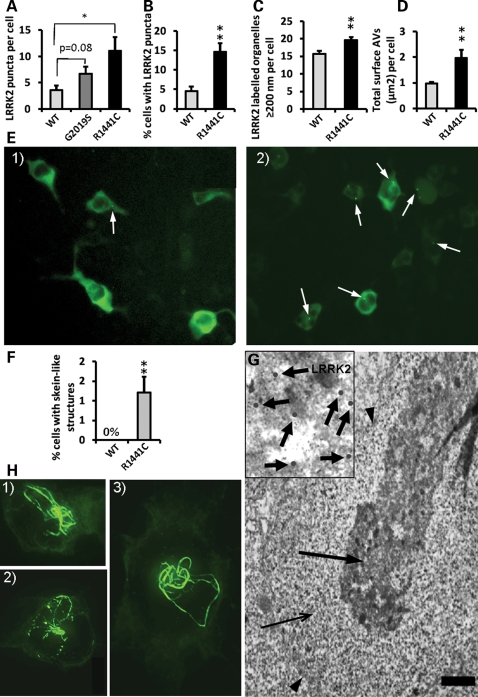
Figure 7.
LRRK2 pathogenic mutations increase the number and size of LRRK2 puncta and induce the formation of skein-like structures when expressed from the genomic DNA constructs. (A) Expression of the R1441C LRRK2 pathogenic mutation from BAC-YPet-LRRK2-R1441C showed a ≈3-fold increase respect to WT in the number of LRRK2 puncta per cell (Vero) assessed by IF using anti-GFP antibodies (P < 0.05, Fisher's exact test). Puncta in 20 random labelled cells per genotype were counted using a 63× objective. The G2019G LRRK2 mutation showed a trend of a ≈2-fold increase which did not reach statistical significance. (B) The R1441C mutation also showed a ≈3-fold increase in the percentage of cells (HEK293) harbouring observable LRRK2 puncta assessed by IF (P = 0.0001, Fisher's exact test), illustrated in (E) [E1 (WT) and E2 (R1441C)]. (C) Quantification of the number of labelled organelles >200 nm (the resolution limit of light microscopy) assessed by IEM. (D) The R1441C induced a ≈2-fold increase in the total area per cell occupied by AVs assessed by IEM. The total cell area remained constant between genotypes. (F) The R1441C LRRK2 pathogenic mutation led to the formation of skein-like three dimensional structures in a statistically significant number of cells (P = 0.0038, Fisher's exact test) (HEK293 cells) which are illustrated in z-stack IF pictures H1 to 3 (anti-GFP antibodies). (H) The R1441C LRRK2 skein-like structures were frequently interspersed with LRRK2 puncta and pointed towards a paranuclear location. (G) The skein-like structures appeared under the electron microscope as membrane (arrowheads) contained structures heavily positive for LRRK2 (anti-GFP antibodies) and composed of a densely packed core (thick arrow and amplification in inset) and a fine granular matrix (thin arrow). Scale bar represents 2 µm. Six randomly-chosen fields of view per genotype where analysed using a 20× objective in IF quantifications except where otherwise indicated. Eight randomly-chosen labelled cells per genotype were analysed in IEM quantifications. Counting of all structures was done blind to the genotype. Bars represent mean + SEM. Statistical significances were obtained using a Student's t test except where indicated; *P < 0.05. **P < 0.01.

