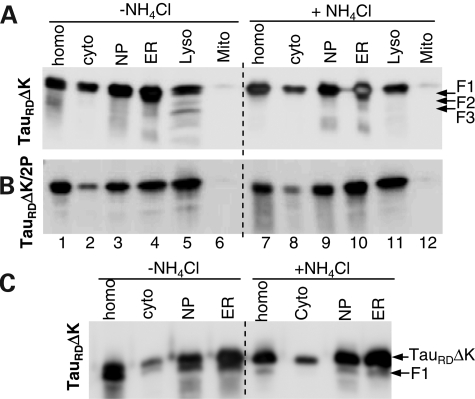
Figure 2.
Distribution of Tau constructs in subcellular fractions of N2a cells. N2a cells induced to express TauRDΔK (A and C) or TauRDΔK/2P (B) were treated without or with NH4Cl for 5 days. The cell homogenates (homo) were fractionated into nuclear pellet (NP), containing nuclei and unbroken cells, cytosol (cyto), ER, mitochondria (Mito) and lysosomes (Lyso). To clearly distinguish the F1 band from the intact TauRDΔK band, the same samples but only half of the amount used in (A) were loaded in (C). Note that fragments F2 and F3 were only detected in the lysosomal fraction from N2a cells expressing TauRDΔK, whereas F1 can be detected in the cytosol or ER fractions.

