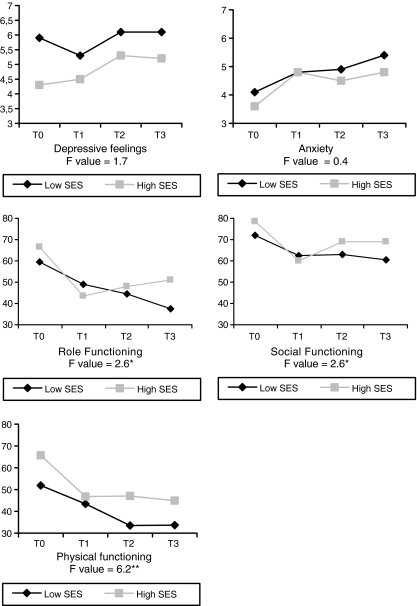
Fig. 2.
Difference in the course of adaptation between socioeconomic groups. T0 baseline premorbid measurement, T1 2 months after the diagnosis, T2 6 months after the diagnosis, T3 12 months after the diagnosis. MANOVA: *p < 0.05; **p < 0.00. Results have been adjusted for age, gender, and severity of the disease (NYHA class). Higher scores indicate better functioning except for depressive feelings and anxiety

