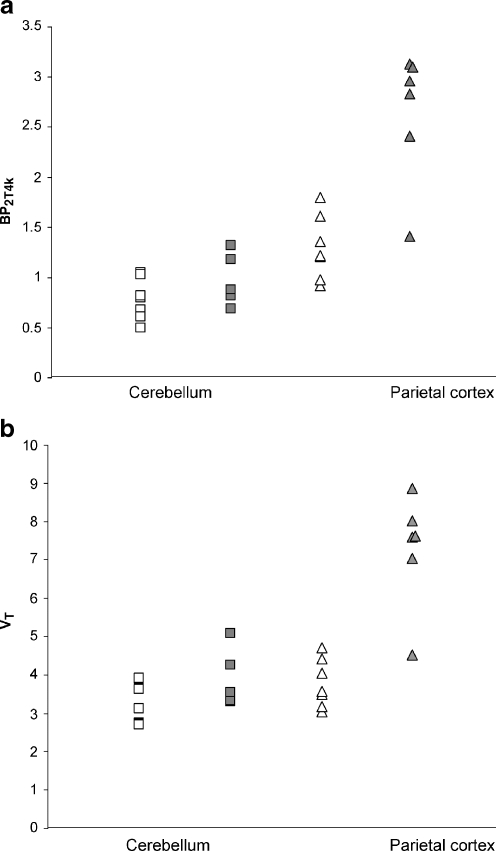
Fig. 3.
Scatter plots showing the distribution of individual subject 2T4k derived values of a BP2T4k and b VT for cerebellum (squares) and parietal cortex (triangles) using plasma input data of six patients with Alzheimer’s disease (AD) (filled symbols) and seven healthy controls (open symbols). Cerebellar BP2T4k and VT did not differ significantly between AD patients and healthy controls (BP2T4kp = 0.19, VTp = 0.11 ). Compared with controls a twofold increase was found in AD patients in the parietal cortex (BP2T4kp < 0.001, VTp = 0.001)

