Fig. 5.
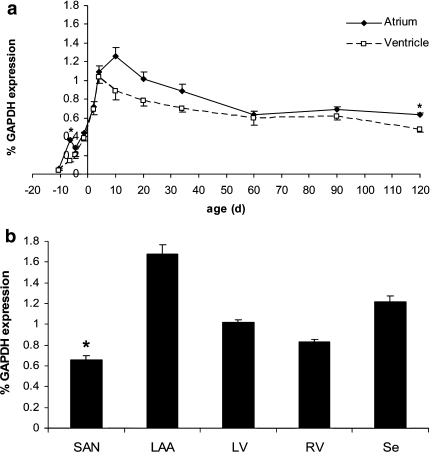
Cardiac Kir2.1 transcription. a From barely detectable levels at E9.5 dpc, Kir2.1 levels rise similarly in atrium and ventricle reaching maximum shortly after birth and slowly decline to adult levels. Statistical analysis: *P < 0.05, atrium versus ventricle compared. b Kir2.1 transcription is lowest in the sinoatrial node (SAN), highest in the left atrial auricle (LAA) and shows intermediate levels in the right (RV) and left ventricle (LV) and interventricular septum (Se). Statistical analysis: *P < 0.05, SAN and LAA, respectively, are compared pairwise to whole atrium at P10. #P < 0.05, LV, RV and Se, respectively, are compared pairwise to whole ventricle at P10 (n = 3)

