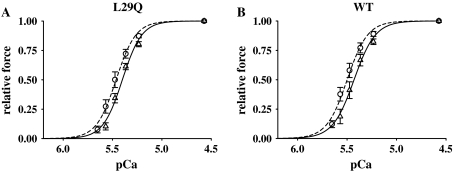
Fig. 2.
Force–pCa relations of fibers reconstituted with hcTnCL29Q or hcTnCWT. Force–pCa relations were measured before extraction of mcTnC (dashed lines, open circle) and after reconstitution with hcTnCL29Q (a) or hcTnCWT (b), respectively (solid lines, open triangle). Symbols represent mean ±SEM for n = 6 preparations

