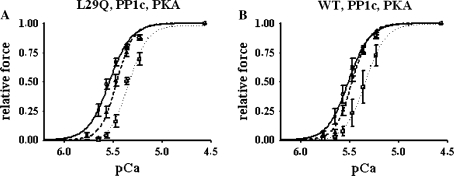
Fig. 4.
Phosphatase and PKA treatment of cTnC-exchanged fibers. Force–pCa relations were measured before extraction of endogenous mcTnC (dashed lines, open triangle) and after reconstitution with hcTnCL29Q (a) or hcTnCWT (b) and treatment with PP1c (solid lines, open circle). After phosphatase treatment, the pCa50 values were not significantly different between fibers reconstituted with hcTnCL29Q or hcTnCWT, respectively. Symbols represent mean ±SEM for n = 5 preparations. After phosphatase treatment, PKA was added (dotted lines, open square), resulting in significant rightward shifts of the force–pCa relations of similar magnitude. Symbols represent mean ±SEM for n = 3 preparations

