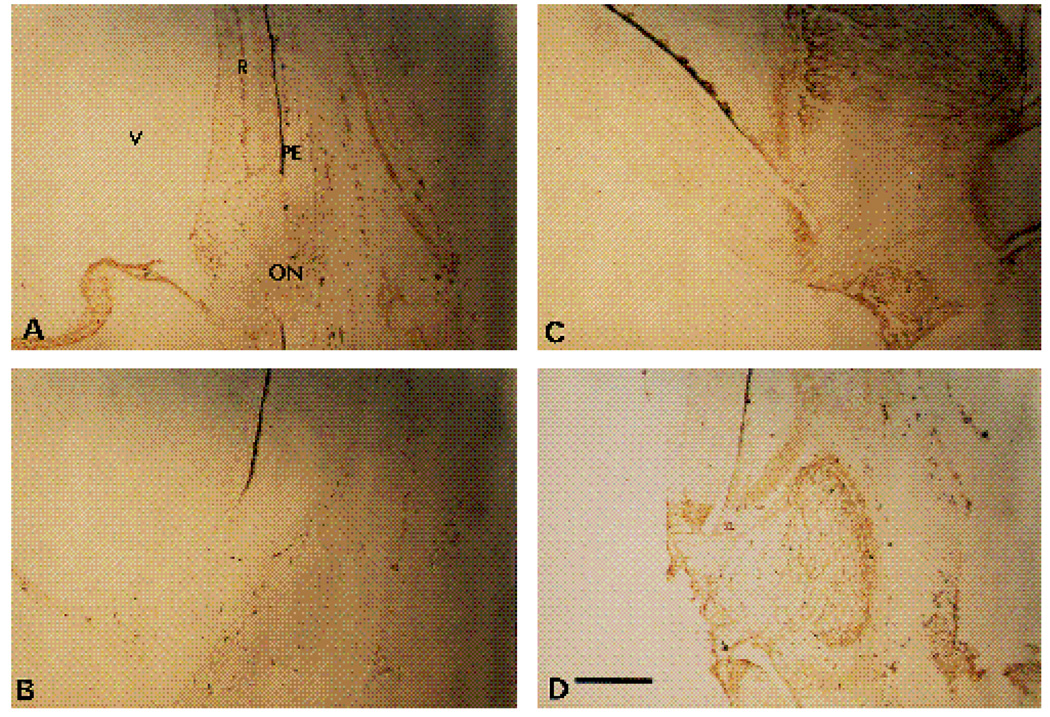
Fig. 7.
Low power micrographs of α6 and α6A expression patterns in E12 chick retina. 16 µm sections were stained with α6EX IgG (A), preimmune IgG for α6EX (B), or α6cytoA (C and D). The region surrounding the optic nerve is visible in each panel. ON, optic nerve; PE, pigment epithelium; V, vitreous. Reaction product is brown. Note localized distribution of α6A in retina adjacent to the optic nerve, within the optic nerve, and in tissues surrounding the retina. Bar, 10 µm.

