Figure 3.
Proliferation and Cell Death in Wild-Type (+/+) and Mutant (−/−) DRG
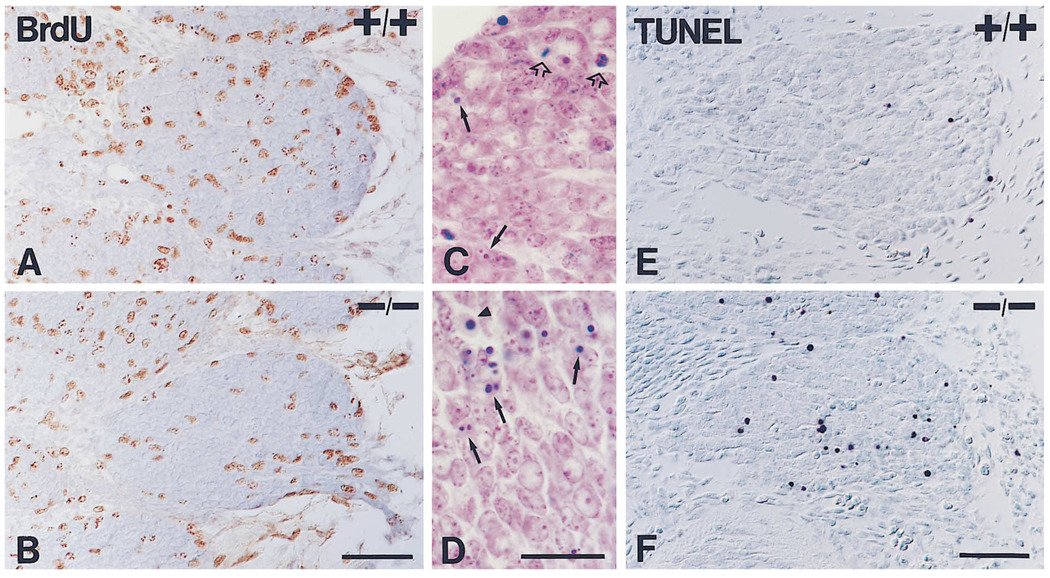
(A–F) Illustrations of assays of proliferation and apoptosis in T1 DRGs of E11 embryos.
(A and B) Immunodetection of BrdU after a 2 hr pulse in E11 wild-type (A) and mutant (B) embryos. Notice that BrdU-positive nuclei are not pyknotic.
(C and D) High magnification micrographs of Nissl stained sections through ganglia of E11 wild-type (C) and mutant (D) embryos. At this stage, pyknotic figures (arrows) and mitotic figures (empty arrows) can be observed. Notice that pyknotic profiles are more frequent in the mutant ganglion. Care was taken to exclude red blood cells (arrowhead) from the quantitation.
(E and F) Sections of ganglia of E11 wild-type (E) and mutant (F) embryos stained with the TUNEL method for the detection of cells undergoing apoptosis. In agreement with an increase in pyknotic figures, the mutant ganglion shows more cells stained by this method. Bars, 100 µm (A and B); 50 µm (C and D); 100 µm (E and F).
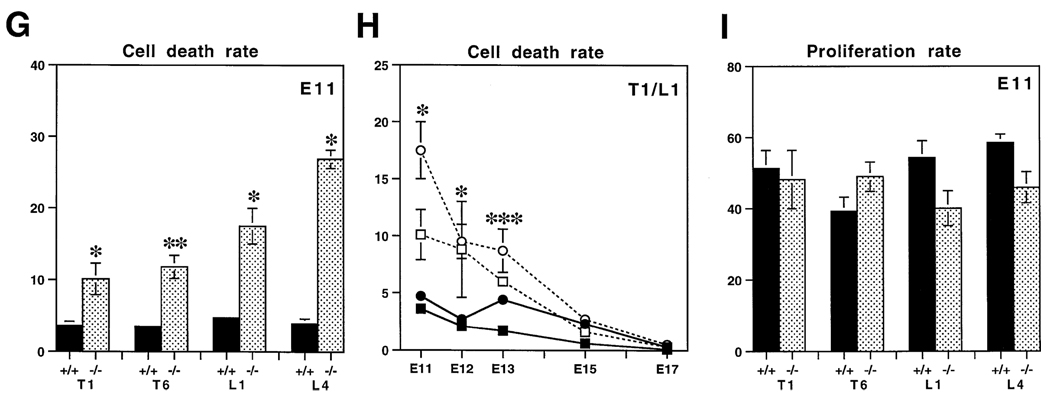
(G–I) Quantification of apoptosis and proliferation in wild-type and mutant DRGs.
(G) Quantitation of the rate of cell death in wild-type (+/+, solid bars) and mutant (−/−, shaded bars) ganglia at stage E11 for thoracic 1 (T1), thoracic 6 (T6), lumbar 1 (L1), and lumbar 4 (L4) DRGs. Dying cells were calculated by counting all pyknotic figures in each of the different ganglia. The numbers are expressed as the relative number of dying cells per total number of cells present in each ganglion. The number of embryos analyzed in each case are the same as in Table 2.
(H) Cell death rates between E11 and E17 in wild-type (filled symbols, continuous line) and mutant (unfilled symbols, dotted line) embryos, obtained by dividing the number of pyknotic figures either by the total number of cells (E11-E13) or by the total number of neurons (E15-E17) present in the ganglia (see Tables 1 and 2). At E10 there are no pyknotic figures. Represented are the values for T1 (squares) and L1 (circles) DRGs as examples. Very similar data was obtained for T6 and L4 DRGs, but are not presented for simplicity. Notice that cell death is significantly elevated in the mutant ganglia at all stages between E11 and E13. At E15 and E17, cell death in the ganglia of both wild-type and mutant animals is very low and is not elevated significantly in mutant ganglia.
(I) Quantitation of the rate of BrdU incorporation in wild-type (+/+, solid bars) and mutant (−/−, shaded bars) ganglia at E11. The rate of BrdU incorporation or labeling index was calculated by dividing the number of BrdU-positive nuclei in each ganglion by the calculated number of precursors (see also Table 3). No significant differences in labeling index were found comparing wild-type and mutant ganglia. In each case, values are represented as mean ± SEM. Statistical significance was tested using a one-tailed Student’s t-test: * p < 0.05, ** p < 0.01, *** p < 0.001.


