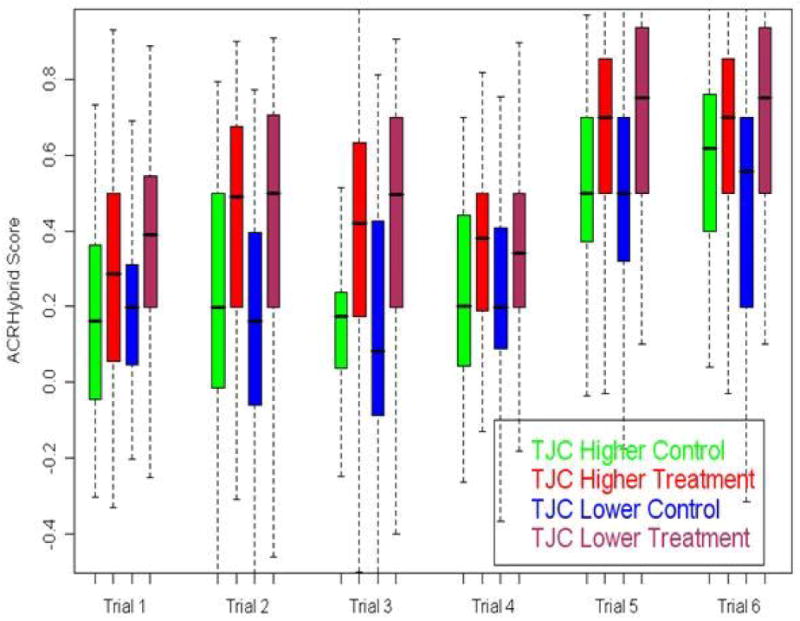
Fig 1.

Boxplot of ACRHybrid Score for Higher and Lower TJC subgroups by trial The lower edge of the box shows the 25th percentile of the data, the upper edge shows the 75th percentile, the line within each box shows the median (50th percentile) and the whiskers extend down to the minimum and up to the maximum. Five out the six trials the treatment-control median score differences are higher in the TJC lower subgroup than that of the TJC higher subgroup.
