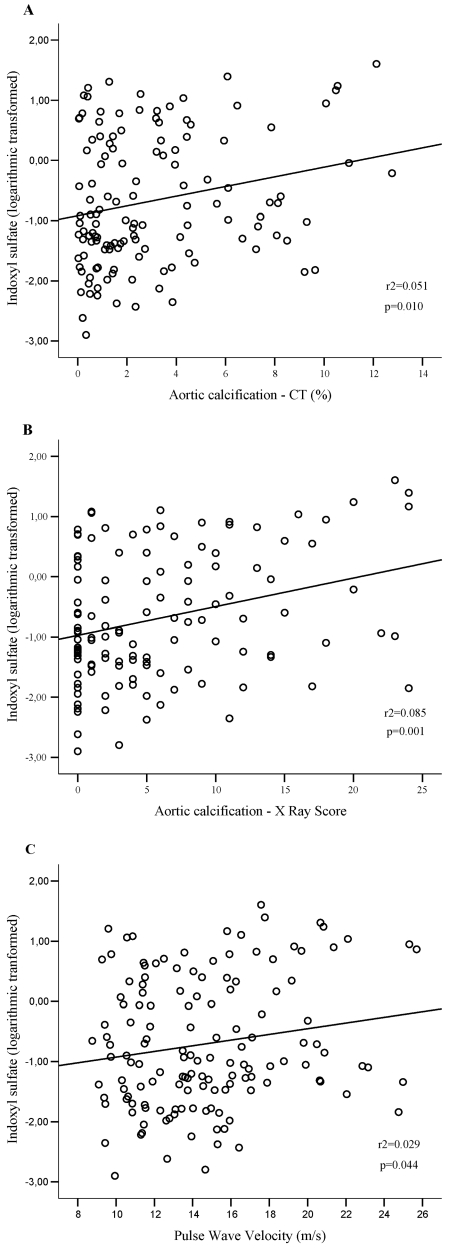
Figure 3.
Linear regression curves. (A) The relationship between serum IS and the aortic calcification score as quantified by MSCT (n = 129). (B) The relationship between serum IS and the aortic calcification score as quantified on a plain, abdominal x-ray (n = 122). (C) The relationship between serum IS and PWV (n = 139).

