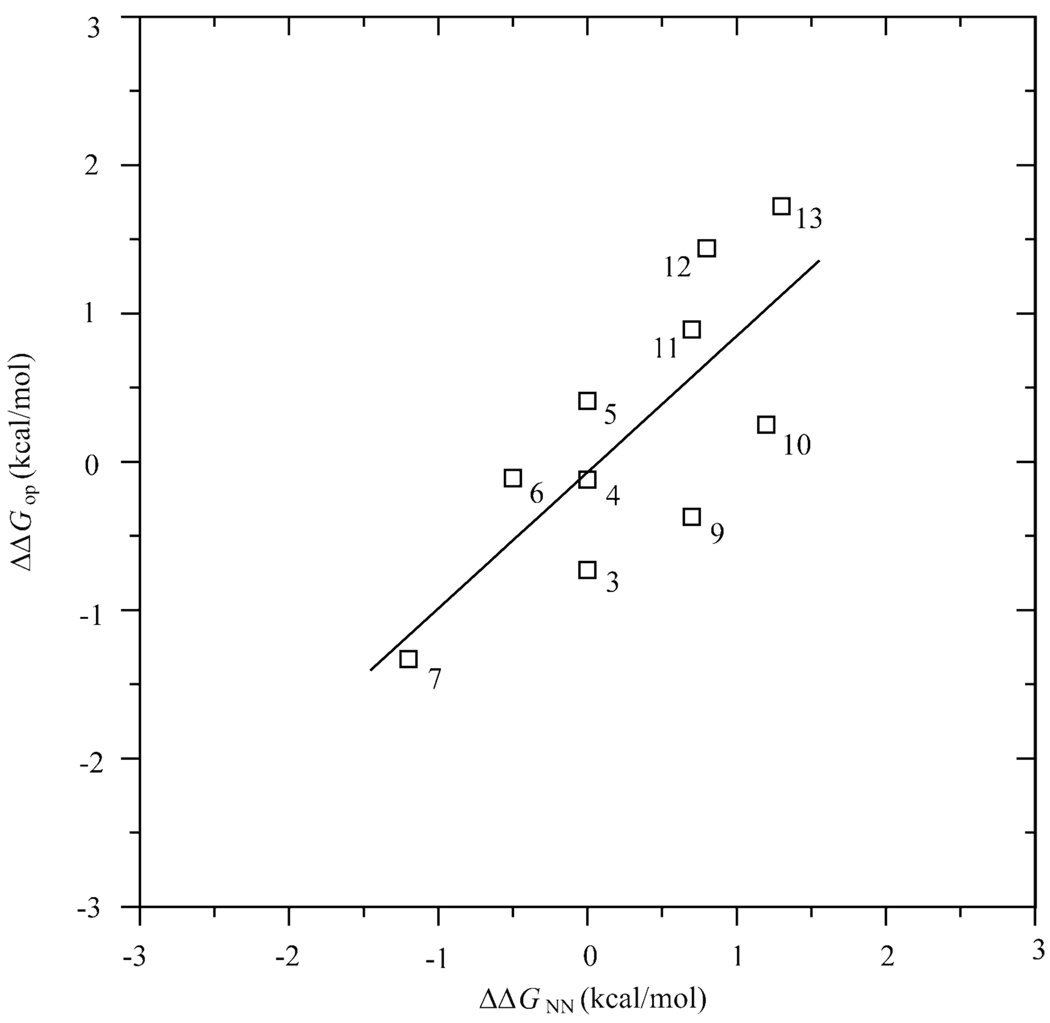
Figure 8.
Correlation between the differences in base-pair opening free energies (ΔΔGop ) in the two RNA-DNA hybrids investigated and the differences in the NN free energies (ΔΔGNN) predicted by duplex melting data (35). The line represents the least-squares fit ΔΔGop (−0.1 ± 0.2)+(0.9 ± 0.3)· ΔΔGNN. The position of each base pair in the two hybrids is indicated for each point.

