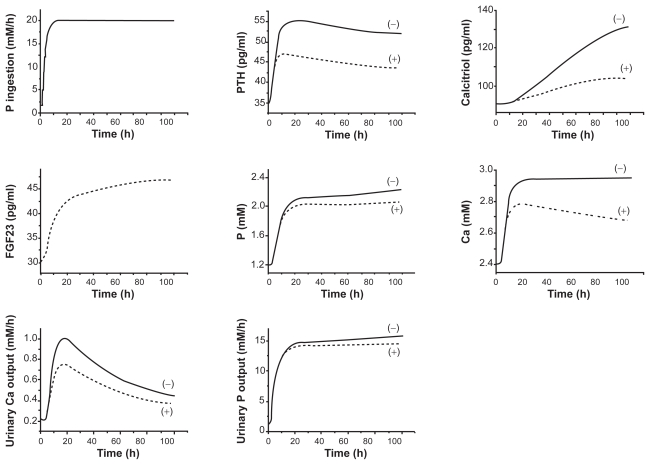
Figure 4.
Transient responses (0–100 h) to a stepwise increase in P. The dotted and solid curves correspond to the responses with and without the action of FGF23. The variables include the stepwise increase in P, the concentrations of PTH, calcitriol, FGF23, phosphate, and calcium in serum, and the excretion levels of calcium and phosphate in urine.

