Abstract
Understanding a mechanism of bone remodeling is a challenging task for both life scientists and model builders, since this highly interactive and nonlinear process can seldom be grasped by simple intuition. A set of ordinary differential equations (ODEs) have been built for simulating bone formation as well as bone resorption. Although solving ODEs numerically can provide useful predictions for dynamical behaviors in a continuous time frame, an actual bone remodeling process in living tissues is driven by discrete events of molecular and cellular interactions. Thus, an event-driven tool such as Petri nets (PNs), which may dynamically and graphically mimic individual molecular collisions or cellular interactions, seems to augment the existing ODE-based systems analysis. Here, we applied PNs to expand the ODE-based approach and examined discrete, dynamical behaviors of key regulatory molecules and bone cells. PNs have been used in many engineering areas, but their application to biological systems needs to be explored. Our PN model was based on 8 ODEs that described an osteoprotegerin linked molecular pathway consisting of 4 types of bone cells. The models allowed us to conduct both qualitative and quantitative evaluations and evaluate homeostatic equilibrium states. The results support that application of PN models assists understanding of an event-driven bone remodeling mechanism using PN-specific procedures such as places, transitions, and firings.
Keywords: Petri nets, bone remodeling, metabolic networks, invariant analysis
Introduction
Bone remodeling is a homeostatic process for maintenance of healthy bone through a removal of old bone by osteoclasts followed by deposition of new bone by osteoblasts.1 Since the process is a complex interplay among many molecules and varying types of cells, building a mathematical model is useful for developing therapeutic strategies for patients with metabolic disorders such as osteoporosis. Pioneering modeling works using a set of ordinary differential equations (ODEs) includes evaluation of the effects of parathyroid hormone (PTH) and the role of a signaling system composed of osteoprotegerin (OPG), receptor activator of nuclear factor κB (RANK), and RANK ligand (RANKL).2–4 Although describing a bone remodeling process using ODEs is a basis for quantitative analyses, numerical results often present a challenge in interpreting the role of discrete molecular and cellular events involved in bone remodeling.
Here, we applied Petri nets (PNs) as an alternative approach to simulate interactive events in bone remodeling. Compared to the approach with ODEs, PNs offer several advantages. First, PNs provide graphical representation of individual interactions in the system that seems appropriate for modeling, analysis and simulation of large-scale dynamic systems.5–7 Second, since system behaviors in PNs are monitored by discrete events through the firing of transitions, PNs can offer a framework for implementing complex temporal inter-related events (both synchronous and asynchronous) as well as structural interactions. Third, since any events are generated and transformed in the network model, not only deterministic but also stochastic processes can easily be built in. Fourth, PNs enable us to conduct both qualitative systems analysis (structural characterization) and quantitative analysis (monitoring dynamic behaviors).
PNs have been extensively applied in many engineering areas such as manufacturing systems,8–10 transportation systems,11,12 and communication networks.13,14 Recently, PNs have been applied for modeling and analysis of metabolic pathways. For instance, qualitative analyses have been conducted focusing on place invariants and transitions invariants15,16 as well as steady states of metabolic pathways.17,18 Quantitative analyses have also been performed in calculation of the probability distribution of molecular species19–21 and molecular concentrations.22–24 Few studies, however, have been directed to both qualitative and quantitative analyses with reference to the ODE-based approach. Our particular interest herein is to evaluate ODE-driven equilibrium states using a PN model. This evaluation is especially important for physiological processes like bone remodeling, where variations from homeostatic equilibria may be linked to metabolic disorders.
In order to examine a potential capability of PNs in bone remodeling, it is neither feasible nor desirable to attempt to build models that include many unknown factors. We thus focused on one of the major signaling pathways (OPG-RANK-RANKL pathway) with four dominant bone cell types (two types of osteoblasts and two types of osteoclasts). Using PN models, our qualitative analysis was focused on identifying two properties (place invariants and transition invariants). Place invariants are for characterizing relationships among variables, while transition invariants are for identifying a set of sub-networks in the overall network. In the quantitative analysis, we evaluated the homeostatic equilibrium states based on PNs and compared them with the results obtained from ODEs.
Methods
Derivation of ODEs
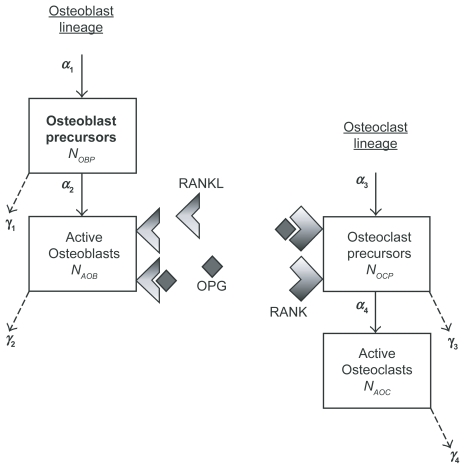
The bone remodeling process was modeled using 8 state variables (4 in the molecular level, and 4 in the cellular level) (Fig. 1). In the molecular level, 4 state variables focusing on OPG/RANK/RANKL pathway were xO(t), xL(t), xOL(t), xKL(t), which corresponded to the concentrations of OPG (O), RANKL (L), RANK (K), OPG-RANKL complex (OL), and RANK-RANKL complex (KL). The first-order ODEs were (ẋ= time derivative of state x; ki = rate constant; pi = synthesis rate; and di = degradation rate):
Figure 1.
Schematic illustration of bone remodeling focusing on interactions among osteoblasts and osteoclasts through OPG/RANK/RANKL pathway.
| (1) |
| (2) |
| (3) |
| (4) |
In the cellular level, 4 state variables represented the numbers of 4 different types of cells (OBP = osteoblast precursors; AOB = active osteoblasts; OCP = osteoclast precursors; and AOC = active osteoclasts). Amplification and differentiation of those cells were modeled:
| (5) |
| (6) |
| (7) |
| (8) |
where N = number of cells; αi = synthesis rate; βi = interaction factor, and γi = degradation rate. The predicted values of the above parameters, employed in this study, are listed in Table 1.
Table 1.
Parameters and RANK concentration employed in equations (1–8).
| Symbol | Value | Unit | Symbol | Value | Unit |
|---|---|---|---|---|---|
| Chemical rates | Cellular proliferation rate | ||||
| k1 | 10 | 1/(nM•day) | α1 | 80 | 1/day |
| k2 | 10 | 1/day | α2 | 0.001 | 1/day |
| k3 | 0.6 | 1/(nM•day) | α3 | 1 | 1/day |
| k4 | 0.02 | 1/day | α4 | 0.2 | 1/day |
| Molecular synthesis rate | Factors for molecular/cellular interactions | ||||
| pO | 200 | nM/day | β2 | 0 | 1/(nM•day) |
| pL | 1 | nM/day | β3 | 0.02 | 1/(nM•day) |
| Molecular degradation rate | Cellular degradation rate | ||||
| dO | 0.35 | 1/day | γ1 | 0.001 | 1/day |
| dL | 0.35 | 1/day | γ2 | 2 | 1/day |
| RANK concentration | γ3 | 0.3 | 1/day | ||
| xk | 1 | nM | γ4 | 2 | 1/day |
Identification of equilibrium states
Although the equilibrium state values vary depending on the parameter values, there is only one equilibrium condition in Eqs. (1–8), where all time derivatives = 0. Their values were analytically derived: xOEQU = 5.71 × 10² nM; xLEQU = 2.86 × 100 nM; xOLEQU = 1.63 × 10³ nM; xKLEQU = 8.57 × 101 nM; NOBPEQU = 80,000; NAOBEQU = 40; NOCPEQU = 9.0; and NAOCEQU = 0.90. Note that the unit for the cell numbers was chosen arbitrary.
Modeling strategy with PNs
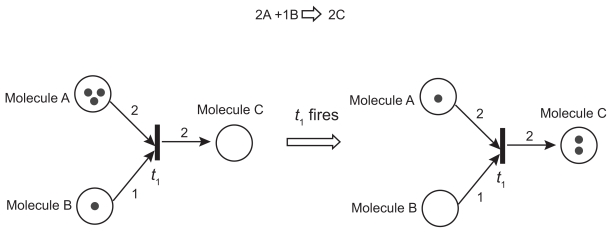
To illustrate our modeling strategy, a simplified version of PN models is shown (Fig. 2). PNs are weighted bipartite graphs with two types of nodes (places and transitions) and arcs. Places (circles in Fig. 2; e.g. molecules and cells) indicate the conditions under which transitions can occur, and transitions (bars in Fig. 2) mark events that alter states (e.g. synthesis, degradation, and chemical reaction). Arcs (arrows in Fig. 2) capture casual relationships as well as interactions among nodes, and they are associated with integer weights that regulate events. The states of PNs are defined by tokens (black dots inside places in Fig. 2), which represent the number of resources (e.g. number of molecules). In the example in Fig. 2, two molecules A and one molecule B are required to synthesize two molecules C, and this event is regulated by the firing of the transition t1.
Figure 2.
Simplified PN model for a molecule synthesis process from molecules A and B to molecule C.
Qualitative PN analysis
In qualitative PN analysis, two behavioral properties (place invariants and transition invariants) were examined. Place invariants are a set of places where the number of tokens in those places remains constant during the evolution (dynamic behaviors) of the system. They identify the processes in which the numbers of molecules or cells stay unchanged. Transition invariants are a set of transitions where their sequences of firings can be reproduced in the specific states. They are useful to capture cyclic reaction processes and can be used to identify reversible subnetworks in metabolic networks.
Quantitative PN analysis
PNs represent discrete state and event-driven systems, and quantitative PN analysis was conducted using numerical integration. In our analysis, the dynamic behaviors in PNs were characterized using a flow of tokens triggered by firings of transitions. The regulatory rules were derived for each firing of transitions from the parameters in ODEs, and tokens were added or removed based on the network structures. Note that since ODEs offer continuous quantities, those continuous quantities were discretized in the simulation step (in terms of the number of tokens in places). Using a set of initial conditions, we traced the numbers of tokens in the places and evaluated their temporal alterations with reference to the equilibrium states derived from ODEs. Although the time axis was defined in terms of the event-driven firing sequences, it was uniquely linked to real time.
Results and Discussion
PN model
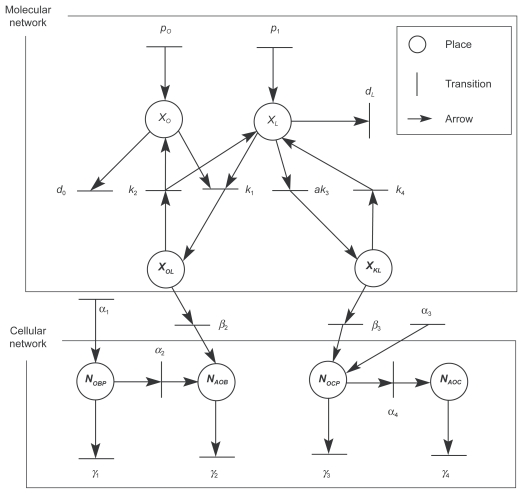
The overall PN model for the selected bone remodeling process is illustrated (Fig. 3). In this model, 8 state variables were considered including 4 variables in the molecular sub-network (concentrations of OPG, RANKL, OPG-RANKL complex, and RANK-RANKL complex) and 4 variables in the cellular sub-network (numbers of osteoblast precursors, active osteoblasts, osteoclast precursors, and active osteoclasts). Eight places (circles) designated these state variables, and interactions and dependencies among them were represented by transitions (bars) derived from Equations (1–8). The entire PN network included 4 chemical rate constants (k1 – k4), 2 molecular synthesis rates (pO and pL), 2 molecular degradation rates (dO and dL), 4 cellular synthesis rates (α1 – α4), 4 cellular degradation rates (γ1 – γ4), and 2 molecular/cellular interaction factor (β2, β3). The two sub-networks were connected through the arrows with (β2, β3), and xk(t) was set to constant as “a”.
Figure 3.
PN model for bone remodeling including a molecular network and a cellular network.
Prior to qualitative and quantitative analyses, we evaluated the sensitivity of the equilibrium states to the selected parameters. We first obtain the equilibrium states analytically from the set of ODEs:
Then a partial derivative of all equilibrium states was derived with respect to each of the chosen parameters such as ∂xO/∂pO; ∂xO/∂dO, …, ∂NAOC/∂γ. There were 144 derivatives corresponding to 8 state variables and 18 parameters, and 43 derivatives were non zero. Two parameters (pL and dL) were involved in the equilibrium states of 6 state variables, while 5 parameters (α2, α4, β2, γ2, γ4) were linked to a single equilibrium state only. Among 6 state variables affected by pL, for instance, the most sensitive state to a variation of pL value was xOL.
Qualitative analysis
The structural PN model in Fig. 3 did not have any place invariants. This result implies that no conservation of molecules or cells that were involved in this metabolic process. However, 11 transition invariants were identified (Table 2). For instance, the invariant sub-network pO → p1 → k1 → β2 → γ2 corresponds to a process of the synthesis of OPG-RANKL complexes from OPG and RANKL and its interaction with active osteoblasts, while the invariant sub-network p1 → ak3 → β3 → α4 → γ4 corresponds to the interactions among RANKL, RANK-RANKL complex, osteoclast precursors, and active osteoclasts. Furthermore, the sub-networks k2 → k1 and ak3 → k4 corresponds to the reversible processes among OPG, RANKL and OPG-RANKL complexes, and between RANKL and RANK/RANL complexes, respectively.
Table 2.
Summary of transition invariants in the PN model.
| Transition invariants | Remarks |
|---|---|
| p0 → p1 → k1 → β2 → γ2 | Synthesis of OPG-RANKL from OPG and RANKL, and its interaction with active osteoblasts |
| pO → dO | Synthesis and degradation of OPG |
| p1 → ak3 → β3 → γ3 | Closed-loop interactions among RANKL, RANK-RANKL, and osteoclast precursors |
| p1 → ak3 → β3 → α4 → γ4 | Interactions among RANKL, RANK-RANKL, osteoclast precursors, and active osteoclasts |
| ak3 → k4 | Reversible process between RANKL and RANK-RANKL |
| k2 → k1 | Reversible process among OPG, RANKL, and OPG-RANKL |
| p1 → dL | Synthesis and degradation of RANKL |
| α1 → α2 → γ2 | Interaction between osteoblast precursors and active osteoblasts |
| α1 → γ1 | Synthesis and degradation of osteoblast precursors |
| α3 → γ3 | Synthesis and degradation of osteoclast precursors |
| α3 → α4 → γ4 | Interaction between osteoclast precursors and active osteoclasts |
Quantitative analysis
Simulation of a sub-network I
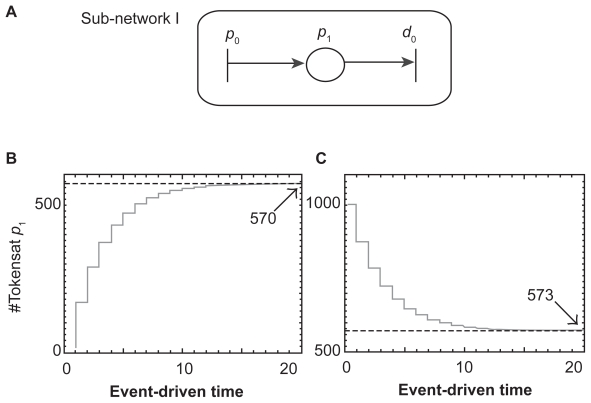
We first examined the transient responses of a simplified PN model (sub-network I) (Fig. 4). In this sub-network, the concentration of OPG, xO(t), assigned in place p1, was expressed in ODE: ẋO(t) = pO − dO xO (t). In our numerical PN simulation, we set pO = 200 nM/day and dO = 0.35/day with two initial OPG concentrations at 5 nM and 1000 nM. The results revealed that regardless of the initial OPG concentration its steady-state concentration approached to the ODE predicted equilibrium (steady-state) value at pO/dO (200/0.35 = 571.4 nM).
Figure 4.
Simulation of sub-network I. A) Sub-network I with a single place, p1. B) Transient response of the token number in the place p1 starting with the initial concentration of 5 nM. C) Transient response of the token number in the place p1 starting with the initial concentration of 1000 nM.
Simulation of the sub-networks I and II
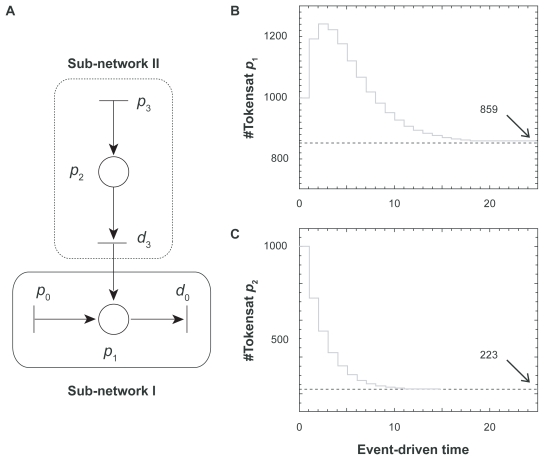
We next evaluated the interaction between two sub-networks, which were described in ODEs as: ẋO(t) = pO + d3x1(t) − dOxO(t) and ẋ1(t) = p3 − d3x1(t), where xO(t) = state variable denoted by place p1, and x1(t) = state variable denoted by place p2 (Fig. 5). The parameters for PN simulations were: pO = 200 nM/day, dO = 0.35/day, p3 = 100 nM/day, and d3 = 0.45/day. Starting with the initial concentrations of 1000 nM at both places p1 and p2, the transient responses (alterations in the numbers of tokens) in the places p1 and p2 are plotted. Because of the interactions between the two sub-networks I and II, the equilibrium states of xO(t) was different from the result in the sub-network I alone. In concert to the ODE-based predictions [(pO + p3)/dO = (200 + 100)/0.35 = 857.1 nM for xO(t) and p3/d3 = 222.2 nM for x1(t)], our PN results offered 859 and 223 for x0 and x1, respectively.
Figure 5.
Simulation of sub-networks I and II. A) Sub-networks I and II including two states places, p1 and p2. B) Transient response of the token number in the place p1. C) Transient response of the token number in the place p2.
Evaluation of the equilibrium states using the entire PN model
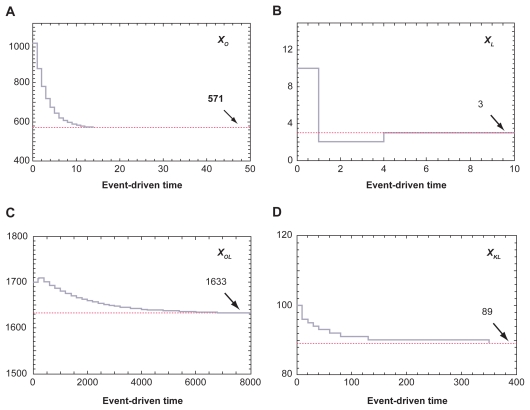
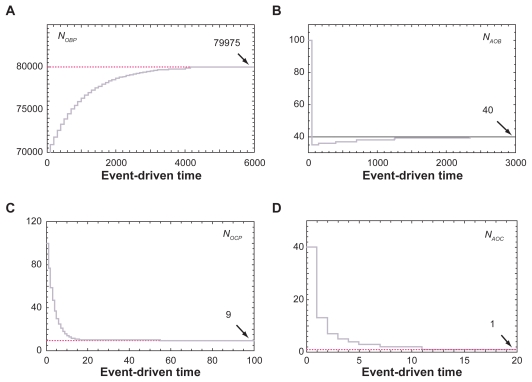
The transient responses for the entire PN model were simulated using the initial conditions that deviated from the ODE predicted equilibrium states. Although time required for reaching steady states varied among 8 state variables, all 8 variables returned closely to the ODE equilibrium states (Figs. 6 and 7). First, the results for the molecular network in Fig. 6 revealed that the steady state PN values were 571, 3, 1633, and 89 nM for xO, xL, xOL and xKL, respectively. The ODE predicted values were 571, 2.86, 1630, and 85.7 nM in this order. Second, the steady state PN values for the cellular network in Figure 7 exhibited 79,975 for NOBP, 40 for NAOB, 9 for NOCP, and 1 for NAOC, while the ODE predictions were 80,000, 40, 9.0, and 0.9 respectively.
Figure 6.
Evolution of 4 state variables in the molecular network towards ODE-predicted equilibrium states. A) Evolution of xO(t). B) Evolution of xL(t). C) Evolution of xOL(t). D) Evolution of xKL(t).
Figure 7.
Evolution of 4 state variables in the cellular network towards ODE-predicted equilibrium states. A) Evolution of NOBP(t). B) Evolution of NAOB(t). C) Evolution of NOCP(t). D) Evolution of NAOC(t).
In the current study, we conducted both qualitative and quantitative analyses. Our qualitative analysis allowed us to identify reversible processes, and determine interactions and dependencies among molecules and cells. The quantitative analysis for equilibrium states enabled to establish a bridge between the ODE-based continuous responses and the event-driven discrete networks. The potential capability of PNs in investigating metabolic networks is multifold. First, unlike ODEs PN models can easily incorporate non-differentiable functions. For instance, administration of therapeutic agents such as OPG can be given in an arbitrary form including a series of impulsive dosages. Second, the potential effect of individual molecules such as RANK can be monitored graphically in any sub-networks. Third, an effect of a single event (e.g. synthesis of one molecule) in the entire PNs can be evaluated. Fourth, differential transient responses and time constants can be determined through temporal evolutions among variables. Lastly, although the described bone remodeling model is much simpler than a true physiological phenomenon, the present PN model can be expanded by adding more places and transitions.
Since OPG can reduce bone resorption through interactions with RANK and RNAKL, it can be used as a therapeutic agent for patients with osteoporosis.25 In order to achieve a suitable outcome without inducing potential side effects, the administration sequence (timing and dosage) needs to be evaluated. We believe that the PN model in the current study can be used to predict a safe, effective administration strategy. Bone is a complex organ, and biological and mechanical characters differ depending on locations. Although the current PN model does not include those local variations, it is possible to differentiate site-specific dynamics by considering additional state variables and parameters.
Conclusion
The study herein presented a unique PN model for evaluation of bone remodeling focusing on the OPG/RANK/RANKL signaling pathway among precursor/active osteoblasts and osteoclasts. The described PN model is able to characterize qualitative (structural) and quantitative (dynamic) properties of the complex homeostatic process. It identified transition invariants (closed-loops and reversible processes) and verified the equilibrium states derived from the associated set of ODEs. Since PN’s discrete network modeling fits well to event-driven physiological responses, further application of PN models should contribute to the understanding of complex molecular and cellular interactions and development of therapeutic strategies in bone remodeling and other biological processes.
Footnotes
Disclosure
The authors report no conflicts of interest.
References
- 1.Raisz LG. Physiology and pathology of bone remodeling. Clin Chem. 1999;45:1353–8. [PubMed] [Google Scholar]
- 2.Lemaire V, Tobin FL, Greller LD, Cho CR, Suva LJ. Modeling the interactions between osteoblast and osteoclast activities in bone remodeling. J Theor Biol. 2004;229:293–309. doi: 10.1016/j.jtbi.2004.03.023. [DOI] [PubMed] [Google Scholar]
- 3.Komarova SV, Smith RJ. Mathematical model predicts a critical role for osteoclast autocrine regulation in the control of bone remodeling. Bone. 2003;33:206–15. doi: 10.1016/s8756-3282(03)00157-1. [DOI] [PubMed] [Google Scholar]
- 4.Kroll MH. Parathyroid hormone temporal effects on bone formation and resorption. Bull Math Biol. 2000;62:163–88. doi: 10.1006/bulm.1999.0146. [DOI] [PubMed] [Google Scholar]
- 5.Peterson JL. Petri Net Theory and the Modeling of Systems. Prentice Hall; 1981. [Google Scholar]
- 6.Murata T. Petri nets: properties, analysis and applications. Proc IEEE. 1989;77:541–80. [Google Scholar]
- 7.Cassandras CG, Lafortune S. Introduction to Discrete Event Systems. Kluwer Academic Publishers; Boston, MA: 1999. [Google Scholar]
- 8.Desrochers AA, AI-Jaar RY. Applications of Petri Nets in Manufacturing Systems: Modeling, Control and Performance Analysis. Institute of Electrical and Electronics Engineers Inc.; New York: 1995. [Google Scholar]
- 9.Zhou M, Venkatesh K. Modeling, Simulation, and Control of Flexible Manufacturing Systems: A Petri Net Approach Series in Intelligent Control and Intelligent Automation. Vol. 6. World Scientific Publishing Co; 1999. [Google Scholar]
- 10.Girault C, Valk R. Petri Nets for Systems Engineering: A Guide to Modeling, Verification, and Applications. Springer-Verlag; 2003. [Google Scholar]
- 11.Tzes A, Kim S, McShane WR. Applications of Petri networks to transportation network modeling. IEEE Trans Vehicular Technology. 1996;45:391–400. [Google Scholar]
- 12.List GF, Cetin M. Modeling traffic signal control using Petri nets. IEEE Trans Intelligent Transportation Systems. 2004;5:177–87. [Google Scholar]
- 13.Merlin PM. A methodology for the design and implementation of communication protocols IEEE. Trans Communications. 1976;COM-24:614–21. [Google Scholar]
- 14.Berthelot G, Terrat R. Petri nets theory for the correctness of protocols IEEE. Trans Communications. 1982;COM-30:2497–505. [Google Scholar]
- 15.Reddy VN, Liebman MN, Mavrovouniotis ML. Qualitative analysis of bio chemical reaction systems. Comput Biol Med. 1996;26:9–24. doi: 10.1016/0010-4825(95)00042-9. [DOI] [PubMed] [Google Scholar]
- 16.Zevedei-Oancea I, Schuster S. Topological analysis of metabolic networks based on Petri net theory. Silico Biol. 2003;3:323–45. [PubMed] [Google Scholar]
- 17.Heiner M, Koch I, Voss K. Analysis and simulation of steady states in metabolic pathways with Petri nets. Proc of the CPN Workshop. 2001:15–34. [Google Scholar]
- 18.Voss K, Heiner M, Koch I. Steady-state analysis of metabolic pathways using Petri nets. Silico Biol. 2003;3:367–87. [PubMed] [Google Scholar]
- 19.Heiner M, Ventre G, Wikarski D. A Petri net based methodology to integrate qualitative and quantitative analysis. Info Software Technol. 1994;36:435–41. [Google Scholar]
- 20.Goss PJE, Peccoud J. Quantitative modeling of stochastic systems in molecular biology by using stochastic Petri nets. Proc Natl Acad Sci. 1998;95:6750–5. doi: 10.1073/pnas.95.12.6750. [DOI] [PMC free article] [PubMed] [Google Scholar]
- 21.Bahi-Jaber N, Pontier D. Modeling transmission of directly transmitted infectious diseases using colored stochastic Petri nets. Math Biosci. 2003;185:1–13. doi: 10.1016/s0025-5564(03)00088-9. [DOI] [PubMed] [Google Scholar]
- 22.Chen M, Hofestaedt R. Quantitative Petri net model of gene regulated metabolic networks in the cell. Silico Biol. 2003;3:347–65. [PubMed] [Google Scholar]
- 23.Matsuno H, Doi A, Nagasaki M, Miyano S. Hybrid Petri net representation of gene regulatory network. Pac Symp Biocomput. 2000;5:338–49. doi: 10.1142/9789814447331_0032. [DOI] [PubMed] [Google Scholar]
- 24.Matsuno H, Tanaka Y, Aoshima H, Doi A, Matsui M, Miyano S. Biopathways representation and simulation on hybrid functional Petri net. Silico Biol. 2003;3:389–404. [PubMed] [Google Scholar]
- 25.Khosla S. Minireview: the OPG/RANKL/RANK system. Endocrinology. 2001;142:5050–5. doi: 10.1210/endo.142.12.8536. [DOI] [PubMed] [Google Scholar]


