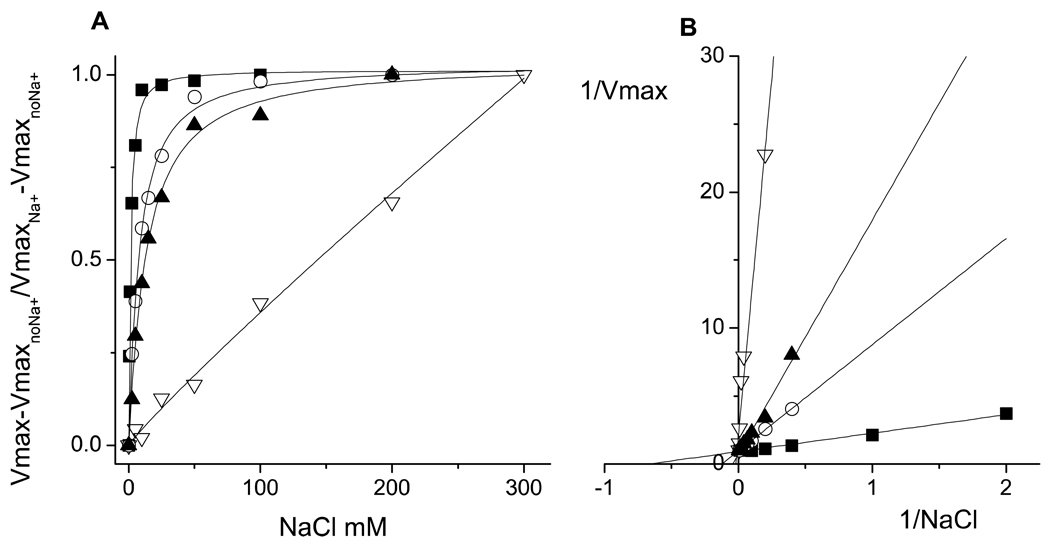
Figure 3.
A. Saturation kinetics for sodium of the wild-type (black squares) and the mutants NqrB-D397A (white triangles), NqrD-D133A (white circles) and NqrE-E95A (black triangles). For presentation purposes the VmaxnoNa+ was subtracted from the individual points of the saturation curves and then the data were normalized by the Vmax value obtained from the fit of the data of each mutant. In the case of the NqrB-D397A mutant data were normalized by the Vmax obtained with 300 mM NaCl, due to the apparently unsaturable behavior. B. Double reciprocal plots of the saturation kinetics. The analysis of the data was performed using non-linear curve fitting with a modified Michaelis-Menten equation (ν= Vmax•Na/(Kmapp + Na) + b) that contains the Vmax and Kmapp values, as well as the activity of the enzyme without sodium (b).

