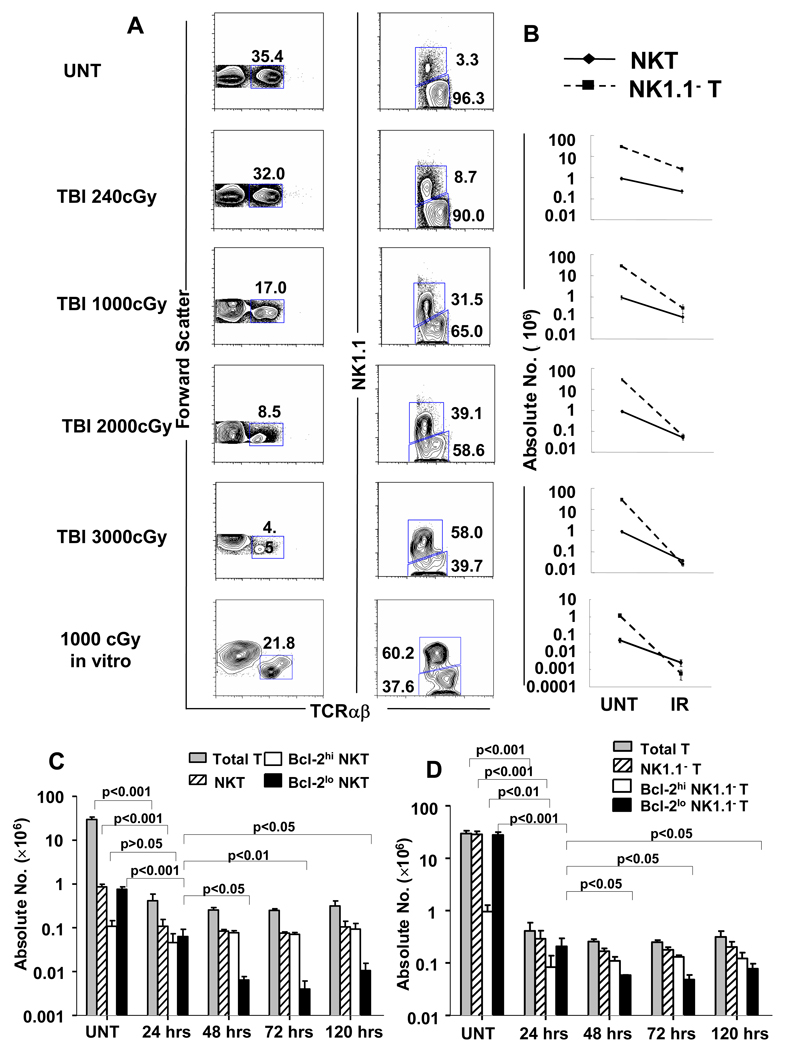
Figure 1. The NKT cell subset becomes predominant among all T cells after TBI in C57BL/6 mice.
(A) Left column; representative flow cytometric analyses of staining for TCRαβ versus forward scatter in the spleen of untreated C57BL/6 mice or 24hrs after 240, 1000, 2000 or 3000 cGy of TBI. The bottom panel shows staining of C57BL/6 spleen cells cultured for 24 hours after 1000 cGy in vitro irradiation for comparison. Boxes enclose TCRαβ+ T cells, and percentages within boxes are given. Right column; two color analyses of TCRαβ versus NK1.1 markers on gated TCRαβ+ T cells from the left column. Boxes enclose NK1.1+ TCRαβ+ T cells (upper box) and NK1.1−TCRαβ+ (lower box). The mean percentage ± SD of NKT cells among all T cells in the spleen of untreated mice was 2.93 ± 0.405, and increased to 8.29 ± 0.630; p<0.0001, 26.00 ± 5.237; p<0.0001, 45.60 ± 6.789; p<0.0001, and 58.35 ± 8.581; p<0.0001 in mice given 240, 1,000, 2,000, 3,000 cGy respectively. There are 8 to 10 mice per group. (B) The mean (±SD) absolute numbers of NK T cells and NK1.1− T cells (non-NKT cells) in the spleen of untreated mice (UNT) and in the spleen 24 hours after each dose of irradiation (IR) are shown on a logarithmic scale. (C) Comparison of mean (±SD) absolute numbers of total T cells, total NKT cells, Bcl-2hi and Bcl-2lo NKT cells in the spleen at different time points after irradiation. (D) Comparison of mean (±SD) absolute numbers of total T cells, NK1.1− T, Bcl-2hi and Bcl-2lo NK1.1− T cells at different time points in the spleen. There are 5 to 10 mice per group. The data are representative of three independent experiments.

