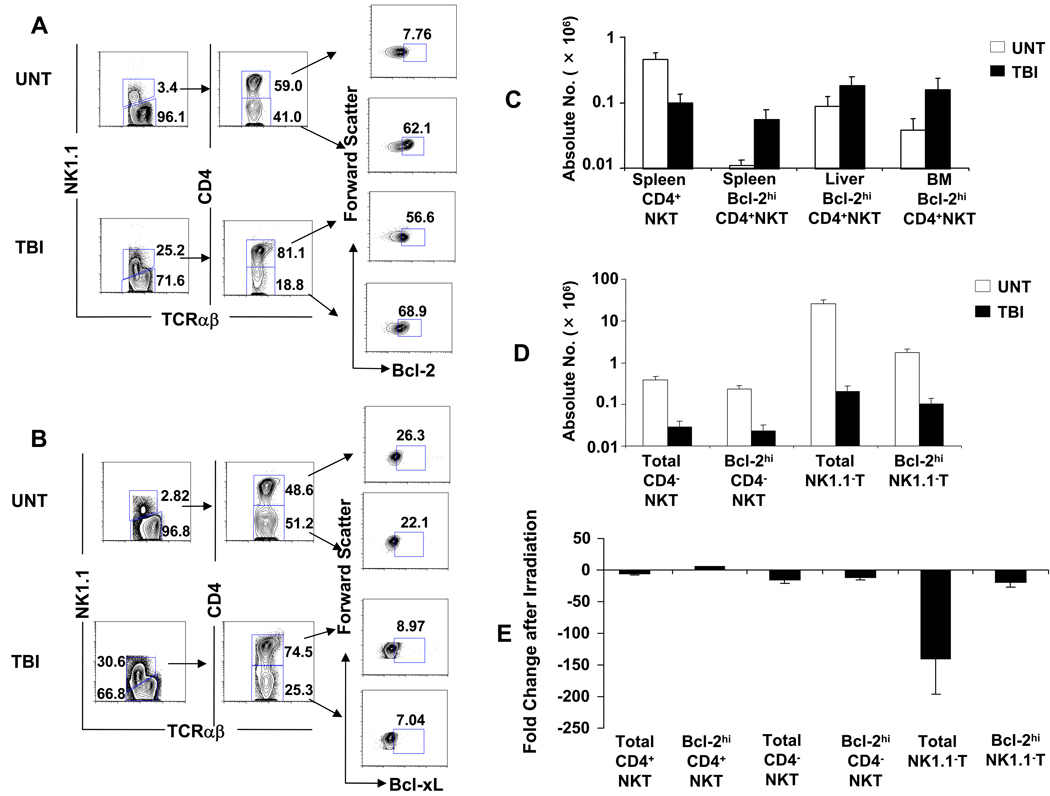
Figure 5. Marked increase in Bcl-2 but not Bcl-xL expression in CD4+ NKT cells that survive after TBI.
(A) Analysis of Bcl-2 expression in CD4+ and CD4−CD8− NKT cell subsets after irradiation. Splenocytes were harvested from untreated C57BL/6 mice or from mice 24 hours after 1,000 cGy TBI. Left panels show NK1.1 versus TCRαβ on gated TCRαβ+ cells; middle panels show CD4 versus TCRαβ on gated NKT cells; right panels show Bcl-2 expression amongst gated CD4+ NKT or CD4−CD8− NKT cells using threshold established in Figure 4. (B) Analysis of Bcl-xL expression in NKT subsets is shown with boxes enclosing cells with staining intensity above background with isotype matched control mAb. (C) Analysis of mean absolute numbers of total or Bcl-2hi CD4+ NKT cell subsets in spleen, liver and bone marrow of untreated mice or after 1,000 cGy TBI. (D) Analysis of mean absolute numbers of total or Bcl-2hi CD4− NKT or NK1.1− T cell subsets. (E) Change in ratio of absolute numbers of different T cell subsets before and 24 hours after 1,000 cGy TBI. There are 10 mice in each group. The data are representative of three independent experiments.

