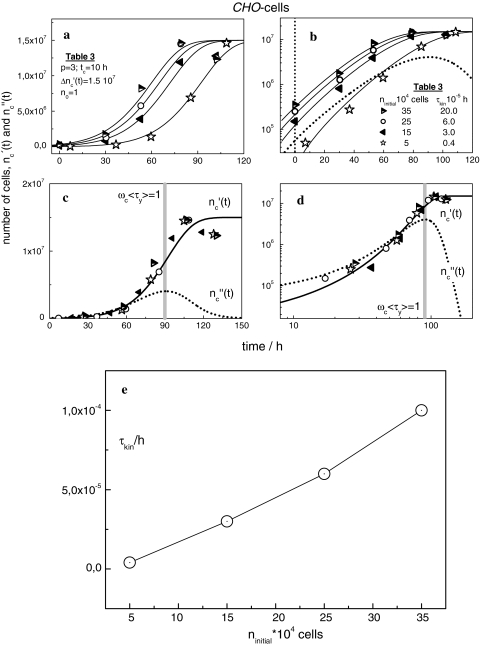
Fig. 3.
(a) Experimentally determined number of CHO-cells cultured from the initial cell concentrations ninitial as indicated [23]. The solid lines are computed with Eqs. 19 and 24 and the parameters in Table 3. The upper limit of the mode spectrum is equal to ln(τ0y.max) = 12.7, i.e. relaxation mode distribution and the universal cell size distribution exhibit the same shape (Eq. 15). (b) Semi-logarithmic plot of the original data and the theoretical curves in (a). (c) Master-curve for n0 = 105 cells. (d) Logarithmic plot of the data in (c). (e) τkin against ninitial

