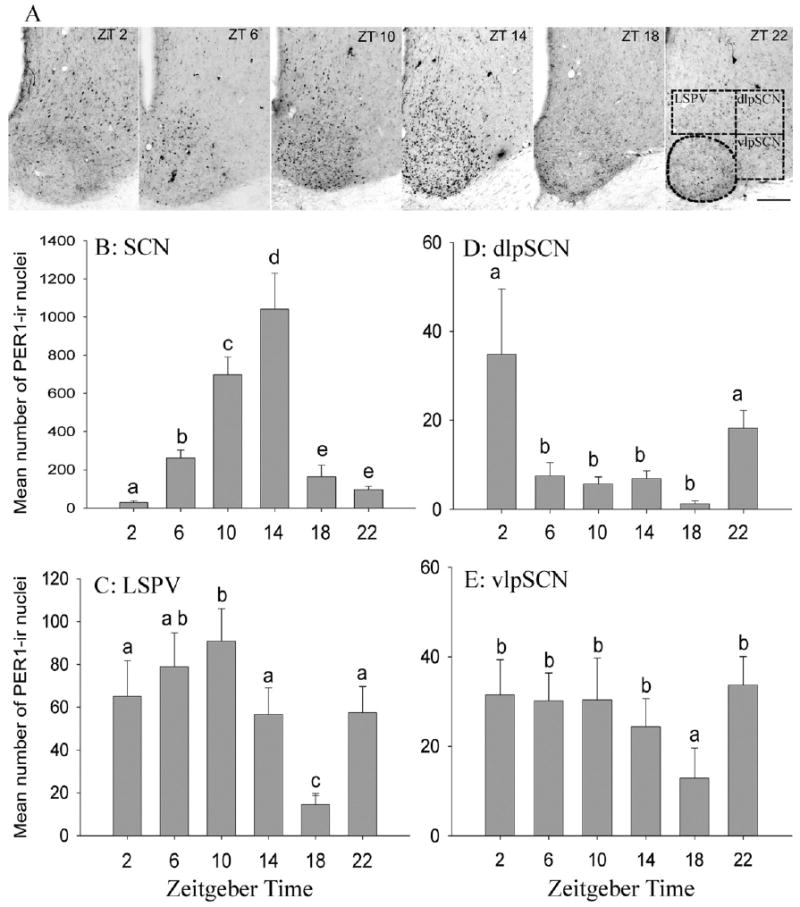
Fig. 2.

Daily rhythms of PER1 expression in the SCN and the pSCN regions. Photomicrographs of coronal sections through the SCN and the pSCN area of representative animals sampled at each of six times of day (A). Note that numbers of PER1 immunoreactive cells are elevated, and distributed across the whole SCN, at ZT 10 and ZT 14, and dorsal to it, in the LSPV, at ZT 10. Sampling boxes for the three areas of the pSCN are indicated in the photo depicting these areas at ZT 22. Scale bar=100 μm. Mean (±S.E.M.) number of PER1-containing cells in the SCN (B) and three sub-regions of the pSCN area (C–E) of female A. niloticus kept in a 12-h LD cycle and killed at 4-h intervals. Significant differences (P<0.05) are noted by different letters.
