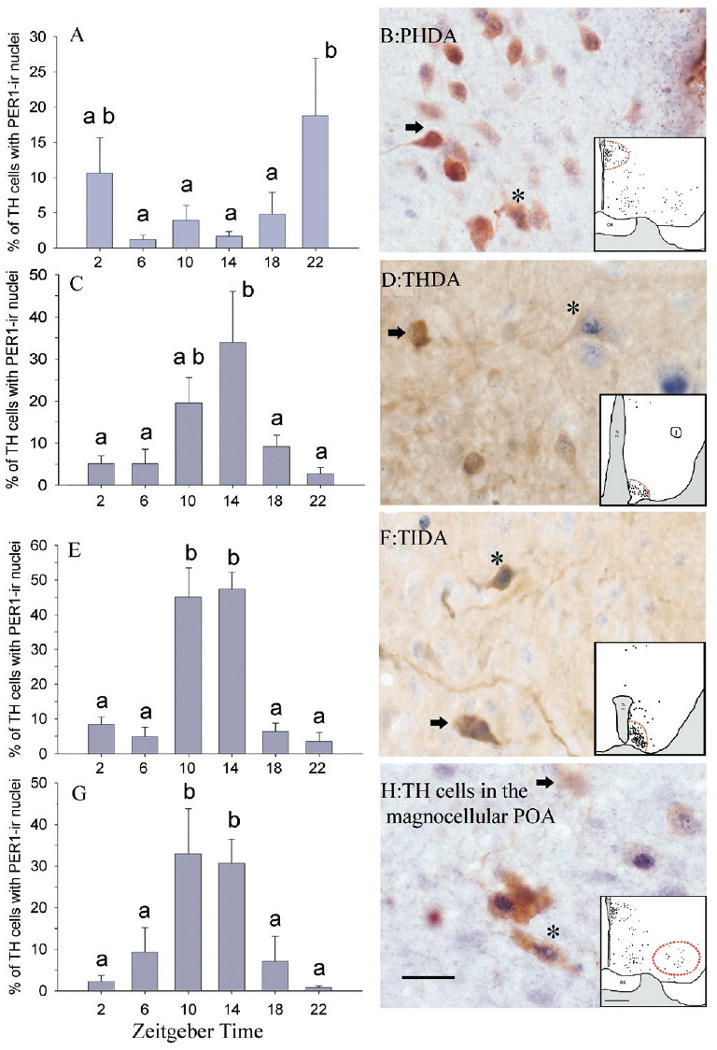
Fig. 4.

PER1 rhythm in four groups of TH-labeled cells. Mean (±S.E.M.) numbers and photomicrographs of PHDA neurons (A, B), THDA neurons (C, D), TIDA neurons (E, F) and magnocellular neurons containing TH in the preoptic area (G, H) of female grass rats. On photomicrographs, cells marked * are double labeled for TH and PER1; arrows indicate neurons expressing only TH. Dotted lines in the inserts depict areas where cells were sampled. Scale bar=20 μm for photomicrographs and 500 μm for line drawings. Other symbols as in Fig. 2.
