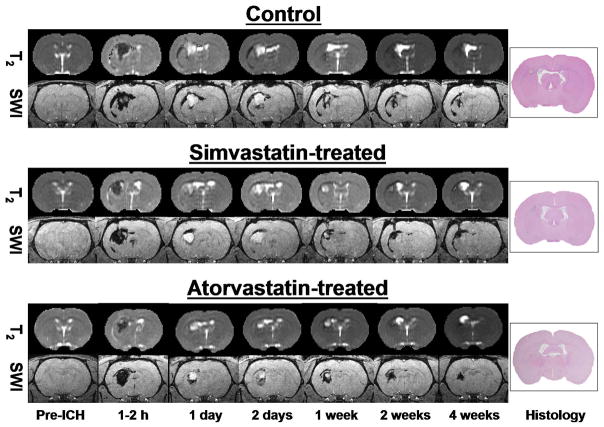
Figure 1.
T2 maps (top row), corresponding susceptibility-weighted images (SWI) (bottom row) and H&E histology section (last column) of the central coronal slice from control (top), simvastatin-treated (middle) and atorvastatin-treated animals (bottom) at baseline, and 1–2 hours, 1 and 2 days, and 1, 2, and 4 weeks post-ICH. The T2 maps showed a dark central core region (low T2) acutely that reversed in intensity later. SWI showed low signal intensity in the core region at 1–2 hours, 2 and 4 weeks, and high intensity at 1, 2 and 7 days.

