
Figure 3.
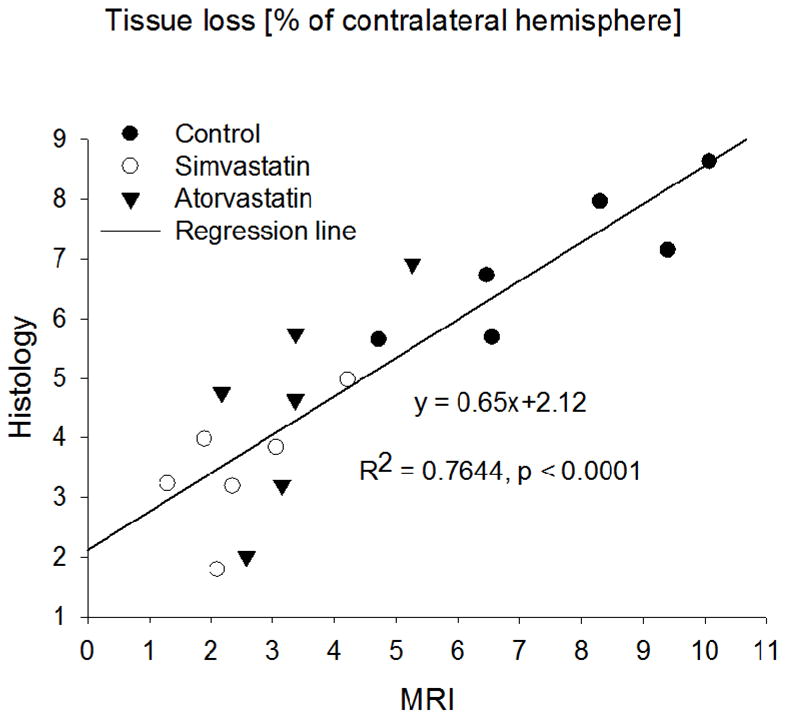
Percentage of ipsilateral hemispheric tissue loss, relative to the contralateral hemisphere, measured 4 weeks post-ICH from T2 maps and histology. The measurements plotted include all three-treatment groups (n=18); the solid line is the linear-regression fit. They were significantly correlated (P<0.0001).