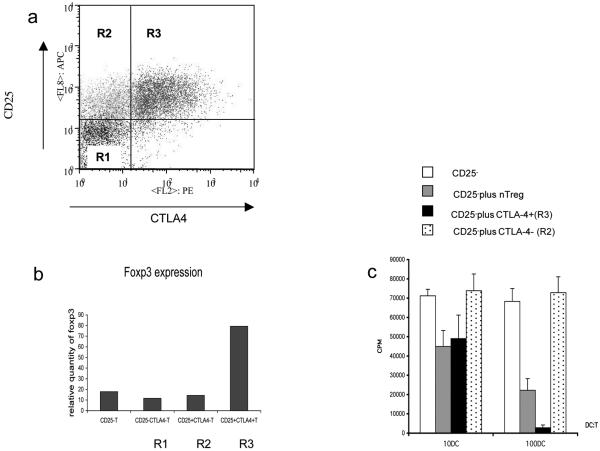
Figure 4. Sorting for CTLA-4 expression at 48h identifies functional Treg.
(a) CD4+CD25- T cells stimulated with CD3/CD28 beads were stained for CTLA-4 (37°C) and CD25 and sorted into the regions shown (R1-R3). (b) Cells were sorted into the regions shown in (a) and recovered for mRNA analysis of FoxP3 expression by PCR. (c) CD4+CD25- T cells stimulated and sorted as shown in (a) were compared with natural Treg for their ability to suppress alloresponses. Fresh CD4+ CD25- T cells were stimulated by DC at different ratios (1:10 or 1:100 - DC:T cells) in the presence of sorted populations shown. Proliferative responses were determined by tritiated thymidine incorporation as measured by scintillation counting at day 5 of culture. Data shown are representative of 3 experiments.

