
Figure 3.
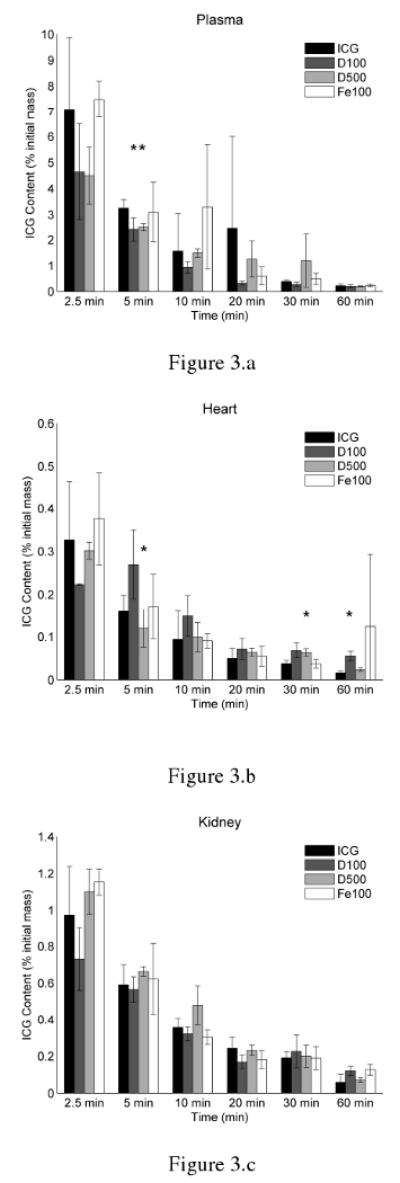
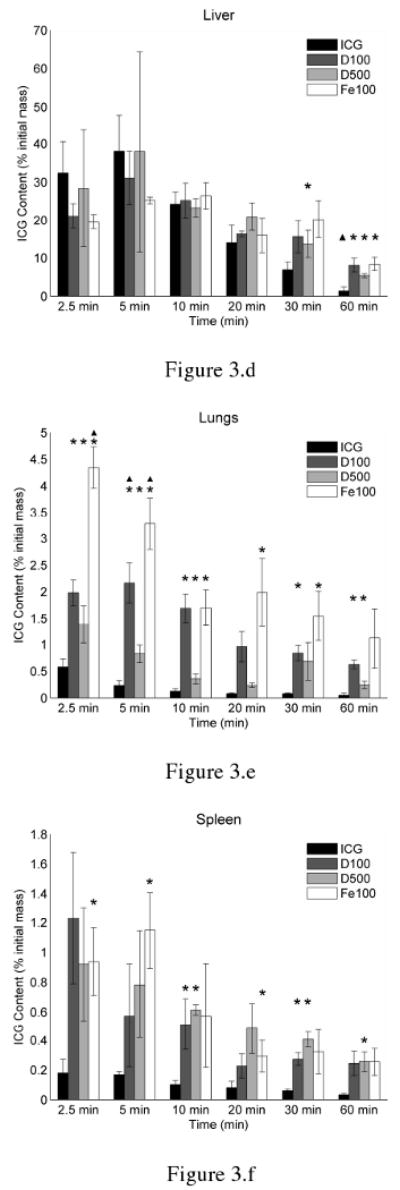
Biodistribution of ICG within (a) plasma, (b) heart, (c) kidneys, (d) liver, (e) lungs, and (f) spleen of healthy Swiss Webster mice at various post-injection times. ICG was delivered either in solution and non-encapsulated (ICG), or encapsulated within 100 nm MCs coated with dextran (D100), 500 nm MCs coated with dextran (D500), or 100 nm MCs coated with magnetite NPs (Fe100). The asterisks indicate a statistical difference (p < 0.05) from free ICG, as determined by student-t test analysis. Triangles indicate which formulations were significantly different from all others, as determined by one-way ANOVA (α = 0.05) followed by application of the Tukey-Kramer conjecture.