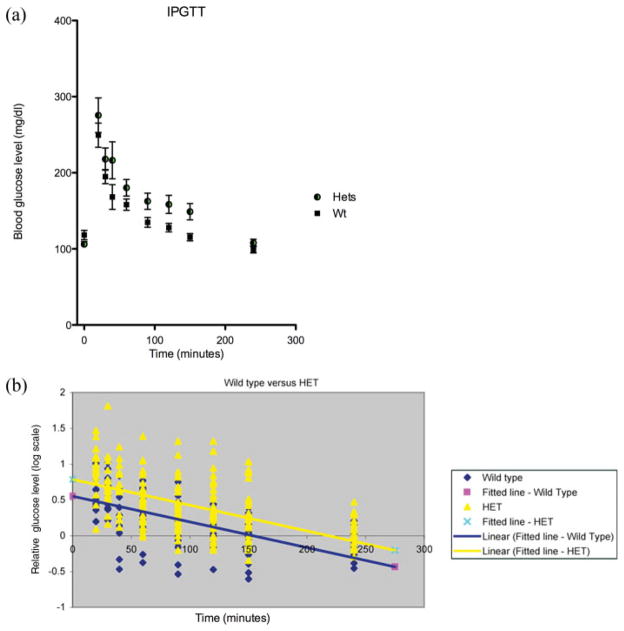
FIG. 1.
Analysis of IPGTT data using the glucose response and Scatter plot. (a) Graph of glucose response to IPGTT. The heterozygous animals showed a larger response to the glucose challenge but tended to return back to resting levels at a normal rate. It is important to note that the erratic nature of many of the heterozygous individuals is lost in the averaging. (b) Scatter plot of log ratios, relative to baseline, of control (in blue) and heterozygous (in yellow), along with their respective linear regression lines. All the data points relative to the initial fasting glucose level from the wild-type control mice (Wt) and heterozygous mice (Het) were averaged to determine the significance of the values for intercept (a pink square and a cross on Y-axis) and the slope (a blue line and a yellow line) between the two genotypes.

