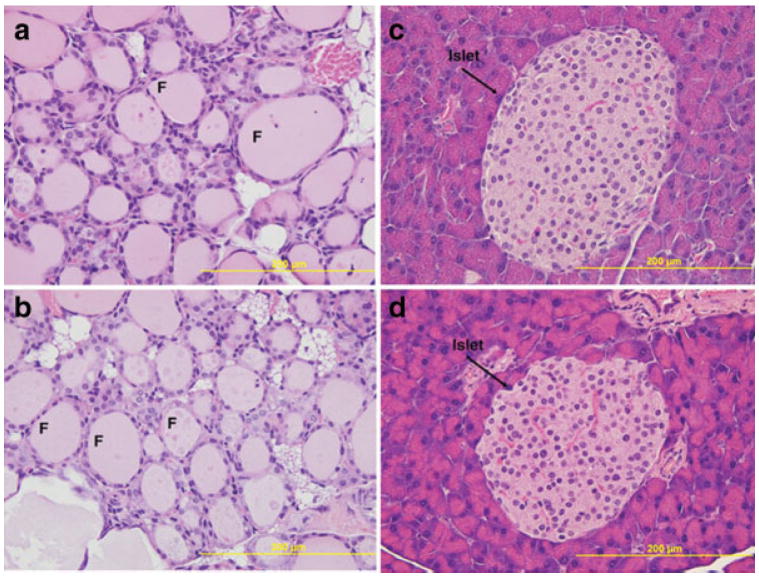
FIG. 3.
Histological analysis of pancreas and thyroid using H&E staining. Histology of thyroid (a, b) and pancreas (c, d), where panels a, c and b, d correspond to the wild type and heterozygous mice, respectively. Paraffin sections were stained with hematoxylin and eosin. No gross abnormalities were observed in either tissue. F, denotes the follicle and the bar represents 200 μm (×40 original magnification).

