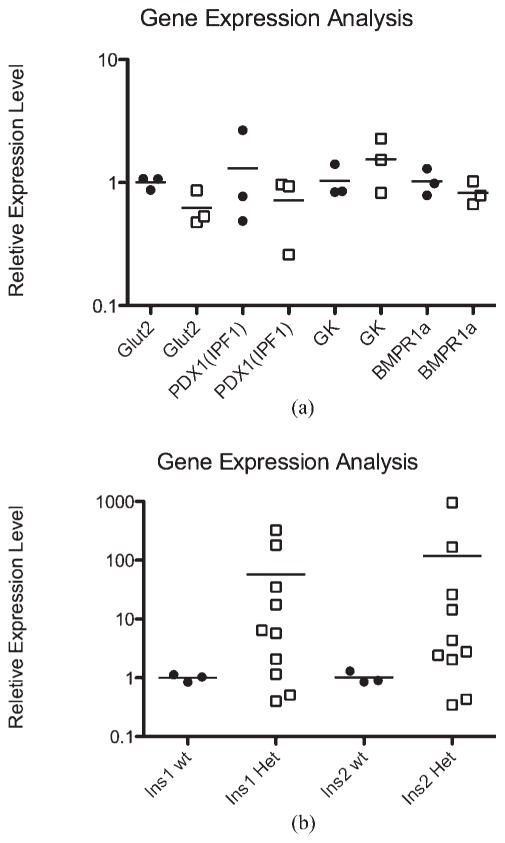
FIG. 4.
Real-time RT PCR analysis. Real-time analysis of selected genes revealed that most of the tested genes were not modified in a substantial way (a). The only genes showing any significant changes were Ins1 and Ins2, with average increases over 50- and 100-fold, respectively (b). Relative expression of genes shown in fold increase on a log10 scale. λ = WT, □= Hets.

