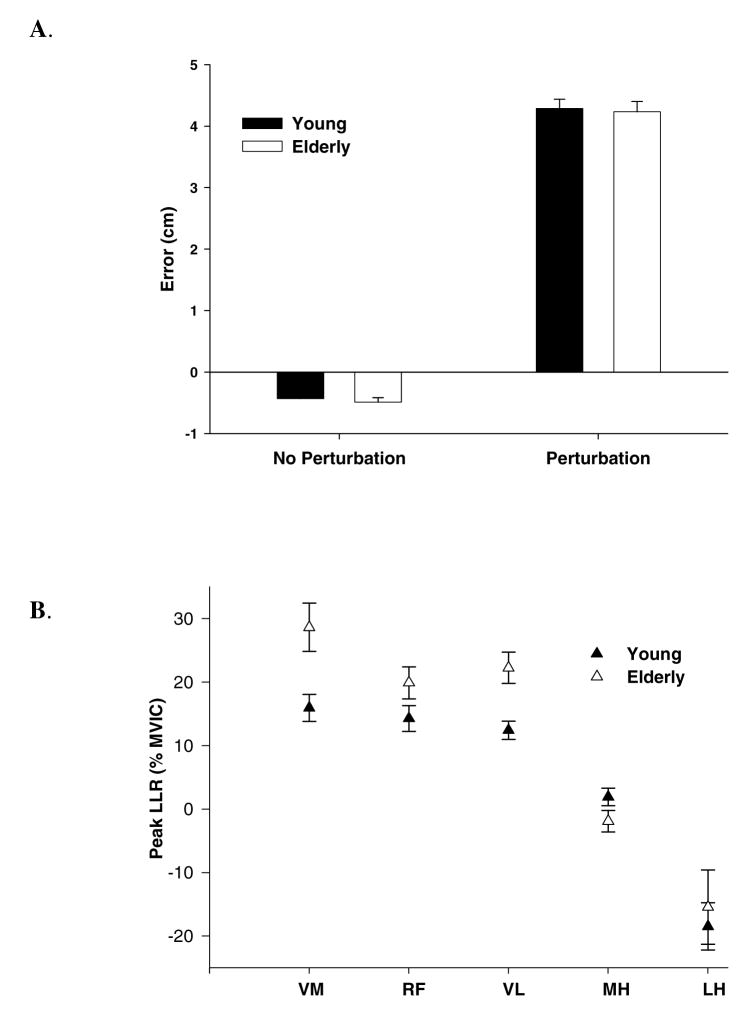
Figure 3.
A. shows the errors of the perturbation and non-perturbation trials for the young and elderly subjects. The white bars represent the young and the dark bars represent the older group. The Y-axis depicts error in centimeters. Error bars represent standard error (± SE).
B. shows the peak long latency responses of the vastus medialis (VM), rectus femoris (RF), vastus lateralis (VL), medial hamstrings (MH) and lateral hamstring (LH). The Y-axis measures the difference of non-perturbation peak EMG activity from perturbation long latency peak EMG activity, as a percent of maximum voluntary isometric contraction (MVIC). The filled symbols represent the young and open symbols represent the older group.

