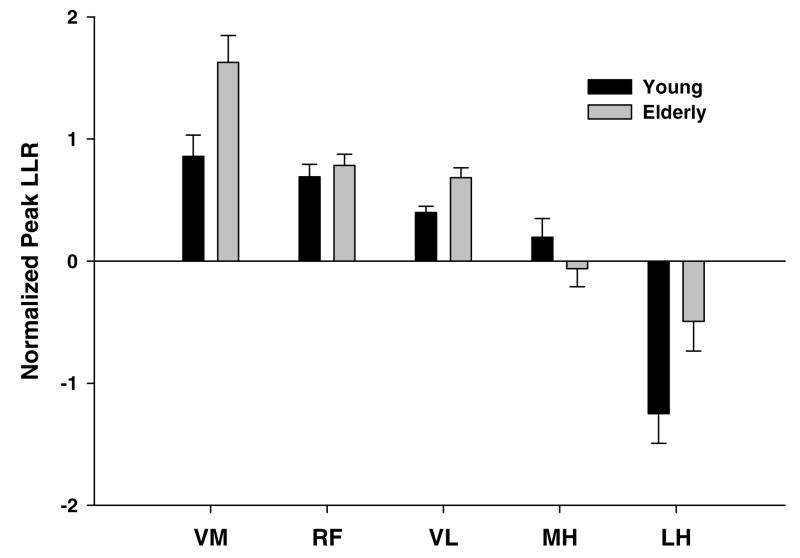
Figure 4.
Normalized peak long latency responses (difference in peak EMG activity between perturbed and unperturbed trials/mean EMG of the unperturbed trial) of the vastus medialis (VM), rectus femoris (RF) and vastus lateralis (VL), medial hamstrings (MH) and lateral hamstring (LH) during 50 – 150 ms following the onset of the perturbation. The white bars represent the young and the dark bars represent the older group.

