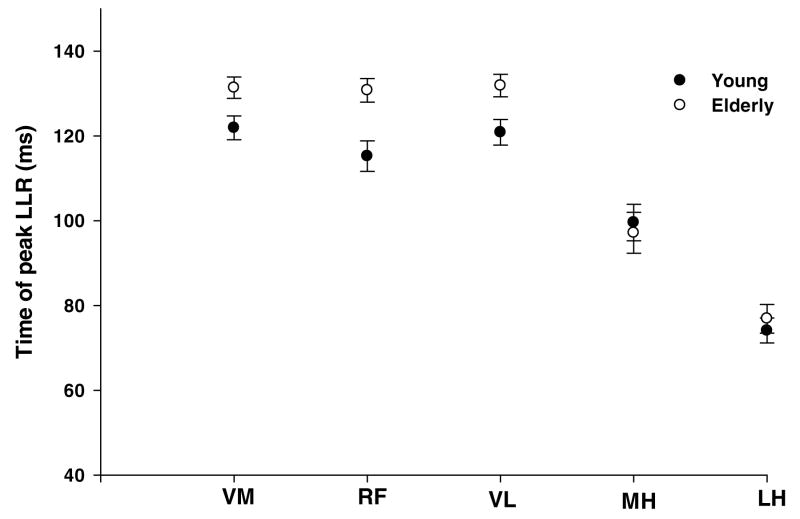
Figure 5.
Time latency of the peak long latency responses of the vastus medialis (VM), rectus femoris (RF), vastus lateralis (VL), medial hamstrings (MH) and lateral hamstring (LH) during the perturbed trials. The Y-axis depicts time (in milliseconds) at which the peak of the long latency response was seen. The filled symbols represent the young and open symbols represent the older group.

