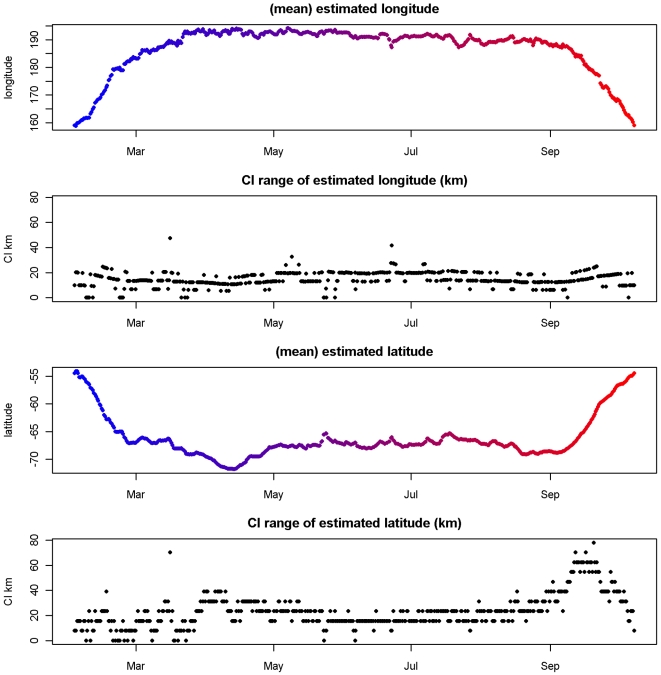
Figure 5. Posterior means for archival dataset.
Posterior means for  from the archival dataset for longitude and latitude, with time scale from red to blue as in Figure 2a. Also shown is the range of the 95% CI of each estimate (km), determined with the mean by directly summarizing the posterior.

