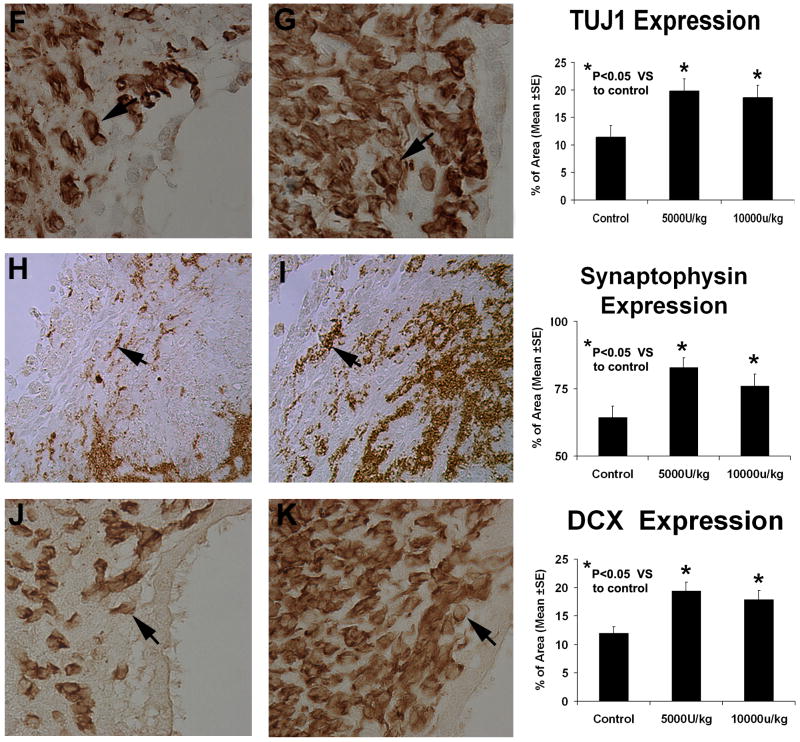
Fig. 3.
Representative immunostaining and quantitative immunoreactivities of TUJ1, synaptophysin and DCX. TUJ1 (panels F and G) and DCX (panels J and K) examples are from the subventricular zone. The synaptophysin example (panels H and I) is from the ICH border zone. Results on the left panels are shown only for the control (panels F, H and J) and low-dose treated groups (panels G, I and K). A higher percentage of per area positively reacting cells to TUJ1, synaptophysin and DCX is seen in the sections derived from rhEPO-treated rats vs control ones. Quantitative immunoreactivities for all three groups are presented as bar graphs on the right side of each panel.

