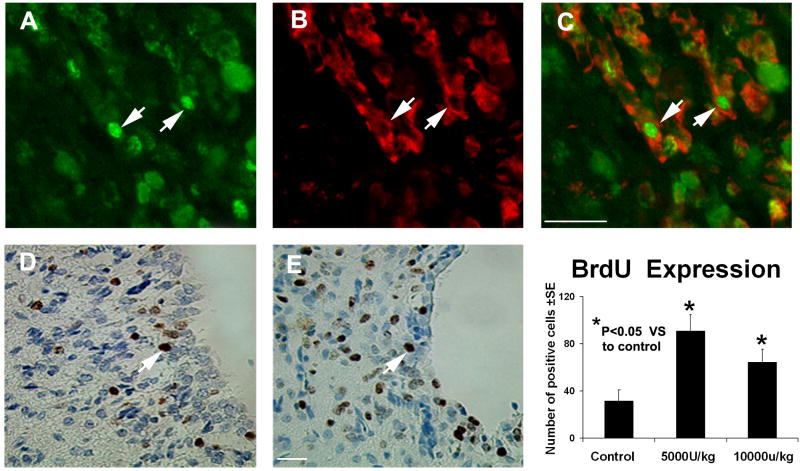
Fig. 4.
Representative immunostaining and quantitative immunoreactivities of BrdU and colocalization of BrdU and TUJ1 immunostaining in the subventricular zone. BrdU results on panels D and E are shown only for the control and low-dose treatment groups, respectively. Quantitative immunoreactivities for all three groups are presented as bar graphs on the right side of panels D and E. Colocalization of BrdU (panel A) and TUJ1 (panel B) in a subpopulation of cells near the injured site of the low-dose treatment group is presented on panel C. Arrows indicate cells that stained positively for both BrdU and TUJ1.

