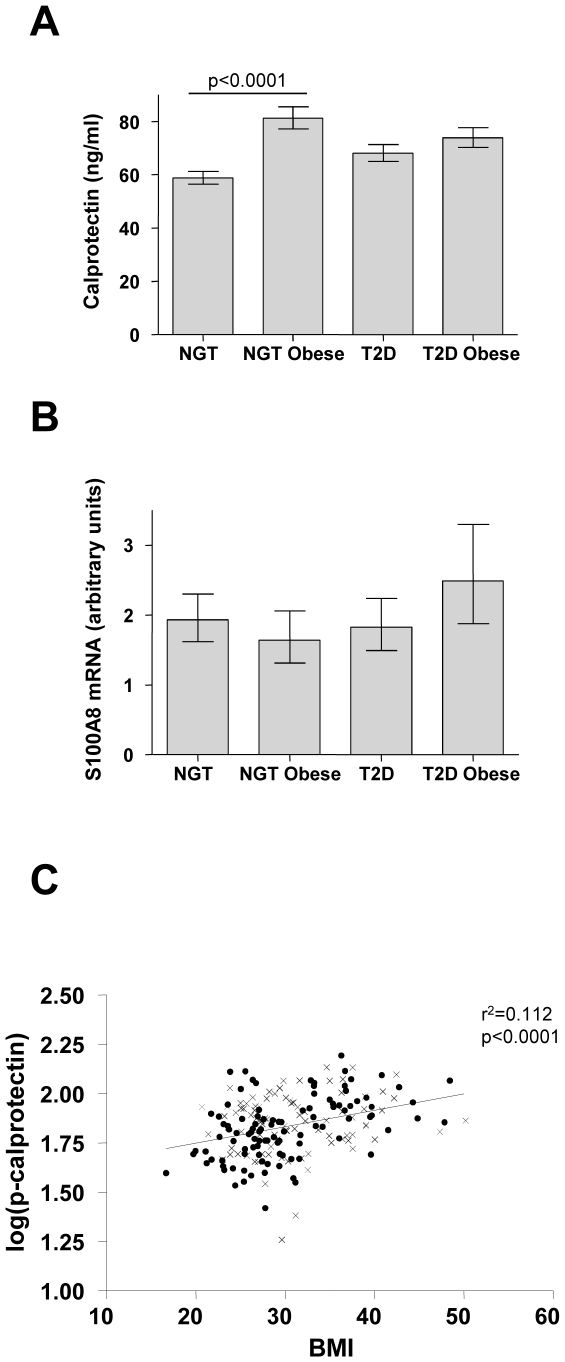
Figure 1. Plasma calprotectin and skeletal muscle mRNA levels in humans.
A) Plasma concentrations of calprotectin are shown for the following four groups: Normal glucose tolerance (NGT)/Non-obese (N = 62), NGT/obese (N = 41), type 2 diabetes (T2D)/non-obese (N = 50), T2D/obese (N = 46). Data are expressed as geometric means; error bars represent 95% confidence intervals (CIs). B) Skeletal muscle S100A8 mRNA are shown for the following four groups: NGT/Non-obese (N = 53), NGT/obese (N = 37), T2D/non-obese (N = 44), T2D/obese (N = 31). Data are expressed as geometric means; error bars represent CIs. C) Log-transformed plasma concentrations of calprotectin, log(p-calprotectin), and BMI, with circles and crosses depicting NGT and T2D subjects, respectively. There was a significant correlation between log(p-calprotectin) and BMI (r2 = 0.112, p<0.0001).

