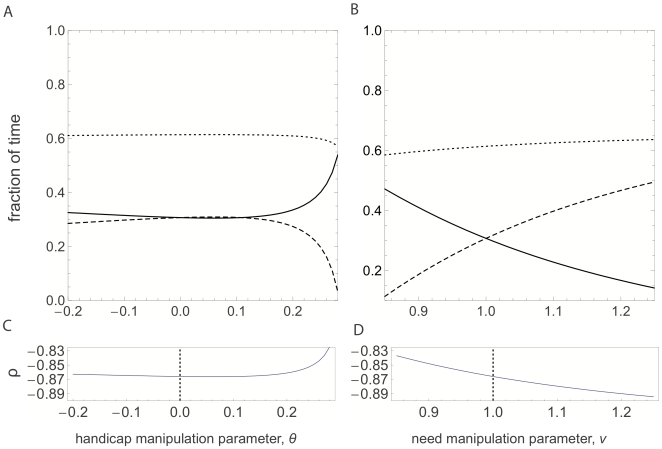
Figure 2. Response of the parents in the almost perfect family.
Panels A and C are again for a handicap manipulation, and Panels B and D are for the need manipulation. Legend same as in Figure 1. The main difference here is that the almost perfect family condition predicts partial compensation in both cases. At the non-manipulated baseline marked with the dotted line, the relative response  has the same value for both types of manipulations.

