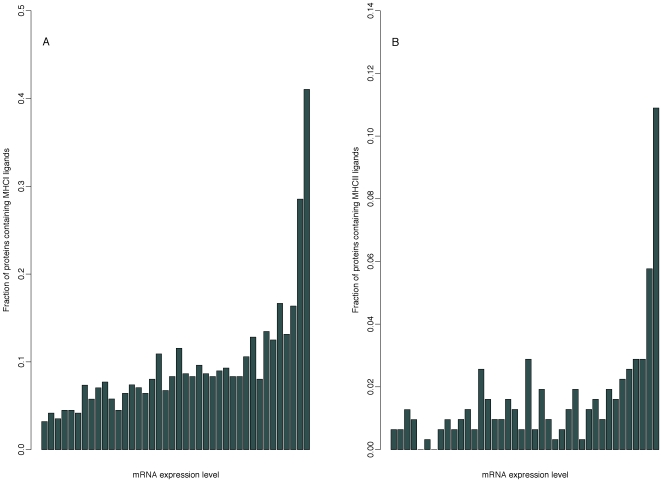
Figure 2. Distribution of MHC ligand-containing proteins relative to their mRNA expression level.
The proteins were grouped into bins of equal size, such that each bin contains 2.5% of all proteins in the data set. As a result, each bin comprises an equal number of proteins, increasing in mRNA expression level from left to right. The height of each bar represents the fraction of proteins that contain MHC ligands. A: Fraction of proteins that contain MHC class I ligands versus the mRNA expression level of the proteins according to the GNF gene expression database B: Fraction of proteins that contain MHC class II ligands versus the mRNA expression level of the proteins according to the GNF gene expression database.

