
Fig. 4.
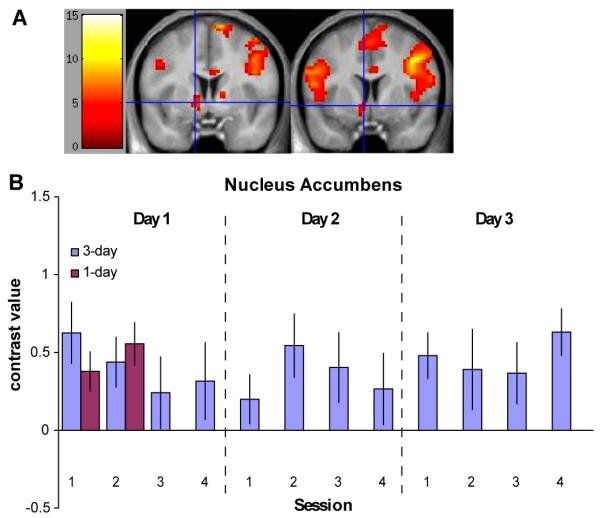
Nucleus accumbens region displaying a phasic response to reward presentation. (A) The nucleus accumbens displayed a significant response to reward presentation for both the 1-day group (left; x = −12, y = 3, z = −3; P < 0.001) and the 3-day group (right; x = −6, y = 6, z = −6; P < 0.001). The blue crosshairs mark the voxels with the peak contrast value. (B) A plot of the contrast estimates for the reward contrast for each training session is shown for the regions displayed in (A). The contrast magnitude remained consistent over training.