Abstract
Epidermal growth factor receptor (EGFR) signaling plays an important role in a majority of solid tumors, and therapeutics targeted against EGFR have demonstrated promise in slowing growth of these tumors. However, many of these drugs either have failed to reproduce promising preclinical model results in clinical settings or have only been successful in a subgroup of cancer patients partly due to incomplete assessment of EGFR status in cancer. A patient-customized, predictive diagnostic for the effects of specific anti-EGFR therapies may improve outcomes. Here we report the development of a hydrogel-based protein array for quantitative and reproducible determination of the activity of EGFR directly from cellular extracts. In this study we used glutathione S-transferase – Eps15 (GST-Eps15) fusion proteins immobilized within a polyacrylamide hydrogel as a substrate for quantifying EGFR kinase activity from the extracts of EGFR-expressing cell lines. Significant EGFR upregulation was detected in a mixture containing 7% EGFR-overexpressing cell lysate diluted in lysate from a cell line expressing low levels of EGFR. Additionally, the GST-Eps15 protein array was capable of detecting inhibition of EGFR activity when incubated with different tyrosine kinase inhibitors. These findings establish the potential of this protein-acrylamide copolymer hydrogel array to not only evaluate EGFR status in cancer cell lysates but also to screen for the most promising therapeutics for individual patients and monitor treatment progression.
Keywords: Protein array, EGFR tyrosine kinase, polyacrylamide, EGFR inhibitors
Background
Cancer has been projected to become the number one death causing disease in the world by 2010, according to the report by International Agency for Research on Cancer (IARC), a division of World Health Organization (WHO). The number of people suffering from cancer doubled globally between 1975 and 2000, and is predicted to double again by 2020 and triple by 2030 [1]. Despite of all the advances made in the conventional cancer treatment, including surgery, chemotherapy, and radiotherapy, the overall survival rate has not improved significantly [2]. Recent therapeutic efforts have been directed toward targeted interference in the signaling pathways which play crucial roles in the development and progression of cancer. Tyrosine kinases have emerged as promising anticancer targets. Of the approximately 20 classes of protein tyrosine kinases (PTKs), the epidermal growth factor receptor (EGFR) family, whose members include HER1 (EGFR), HER2/neu (ErbB2), HER3 (ErbB3), and Her4 (ErbB4) [3], has been the most widely studied.
EGFR is a transmembrane protein comprised of a ligand-binding extracellular domain, a transmembrane domain and an intracellular signal transducing domain with kinase activity. The inactivated monomeric EGFR is activated upon binding of ligands, including epidermal growth factor (EGF), transforming growth factor α (TGFα), heparin binding EGF (HB-EGF), amphiregulin and betacellulin to its extracellular domain [3]. Upon activation, EGFR undergoes dimerization, either forming a homodimer or heterodimer by pairing with ErbB2. This activation leads to autophosphorylation of several tyrosine residues present in the intracellular domain of the receptor. This in turn induces several downstream signaling cascades including proteins like phospholipase Cγ, phosphatidylinositol-3-kinase (PI3K), Akt, and JNK leading to cell differentiation, proliferation, migration, survival and adhesion [3,4]. While the EGFR signaling cascade is essential for homeostasis, dysregulation of EGFR kinase activity has been implicated in the oncogenic transformation of cells [2, 4].
EGFR overexpression, gene amplification, mutations, and increased kinase activity have been observed in many solid cancers of epithelial origin including breast, lung, head and neck, ovarian, bladder, and pancreatic cancers [3, 5]. Overexpression and increased activity of EGFR have been correlated with disease aggressiveness, resistance to chemotherapy, poor prognosis, and development of resistance to the therapeutics [6–13]. Realizing the importance of EGFR activity in cancers led to the development of several therapeutics directed against EGFR. Preclinical studies with different anti-EGFR agents have shown positive responses. Anti-EGFR small molecule inhibitors and monoclonal antibodies which have already been approved by the FDA for treatment of different cancers include gefinitib (ZD1839), erlotinib (OSI-774), cetuximab (IMC-C225), and panitumumab (ABX-EGF). Other agents targeting EGFR, such as bispecific antibody MDX-447, recombinant vaccine EGF-P64k, and antisense oligonucleotide AS-21, are at different phases of clinical/preclinical trials [12, 14]. Reduced tumor activity and improved symptom relief have been observed after administration of these drugs alone or in combination with other conventional therapies [12, 15]. Since EGFR acts as a prognostic indicator in different cancers, measuring tumor EGFR signaling activity (i.e. from a tissue biopsy) may be beneficial in initial prognosis, selection of an effective treatment, and monitoring treatment progression.
Here we report the development of a hydrogel-based protein array capable of quantitatively assessing EGFR tyrosine kinase activity in cell lysates. Prior studies in our lab have shown the application of acryl-labeled glutathione S-transferase fused Crkl (GST-Crkl) immobilized in polyacrylamide arrays for measuring Bcr-Abl kinase activity in K562 cell extracts [16]. In this study we have used EGFR pathway substrate 15 (Eps15) as the substrate for measuring EGFR kinase activity. Since many cancers overexpress EGFR or express EGFR-containing activating mutations (e.g. non-small cell lung cancer (NSCLC) and squamous cell carcinoma of head and neck) [17,18], an assay which will directly measure the activity of EGFR may provide a more accurate report of the disease state than the conventional methods which quantify EGFR at DNA, RNA or protein level. Eps15, initially identified as EGFR kinase substrate, was later implicated in endocytosis [19–22]. Even though studies have shown that Eps15 is phosphorylated most efficiently by EGFR in vitro at tyrosine 850 [19, 23], to the best of our knowledge Eps15 has never been used as a substrate to quantify EGFR kinase activity. In this study we used a GST-fused fragment of Eps15 (amino acids 758-881, GST-Eps15) as the substrate for measuring EGFR kinase activity directly in the extracts of cell lines. Here, we report the ability of the hydrogel based protein array to measure EGFR kinase activity in the lysates from cells of different carcinogenic origin, namely breast cancer (MDA-MB-468 and MDA-MB-453), lung adenocarcinoma (NCI-H23) and epidermoid carcinoma (A431), with different levels of EGFR expression (high: MDA-MB-468 and A431; low: MDA-MB-453 and NCI-H23).
Materials and Methods
Preparation of fusion protein
Eps15 was obtained by amplifying the DNA sequence encoding amino acid from 758 to 881, encompassing Y850, from human embryonic stem cell (H1) cDNA. PCR primers were designed such that BamHI and XhoI restriction sites flanked the 5’ and 3’ ends of the encoded Eps15 fragment. After digestion with BamHI and XhoI, the fragment was cloned in frame into the pGEX-4T-1 vector (Amersham Biosciences, Piscataway, NJ). This plasmid was then transformed into DH5α E. coli cells and correct insertion of the gene in selected clones was confirmed by DNA sequencing. For the production of the fusion protein, these cells were then grown to mid-log phase in 2X YT (16 g tryptone, 10 g yeast extract, 5 g NaCl, pH 6.6 in 1000 mL water) at 37°C and then the protein production was induced by addition of 1mM isopropyl-β-d- thiogalactopyranoside (IPTG). After 4 hr, the cells were centrifuged at 3,500g at 4°C for 10 min. To wash, the pellets were resuspended in cold PBS and centrifuged once again. The pellets were then again resuspended in cold PBS containing 1 mM phenylmethylsulfonyl fluoride, 1% Triton X-100 and 1 mM activated sodium orthovanadate and mildly sonicated. The sonicate was centrifuged at 4°C for 10 min at 14,000 g. GST-Eps15 was purified by affinity chromatography by passing the solution through glutathione sepharose column (GE Healthcare) and concentrated in 10 kDa molecular weight cut off centrifugal filter (Millipore). Total protein concentration was determined using a BCA protein assay kit (Pierce, Rockford, IL) and the lysates were stored at −80°C until further use.
Cell Culture and Lysate Production
Human breast cancer (MDA-MB-468 and MDA-MB-453), human lung cancer (NCI-H23) cells and human epidermoid carcinoma (A431) cell lines were obtained from ATCC (Manassas, VA). MDA-MB-468, MDA-MB-453, and NCI-H23 cells were maintained in RPMI-1640 (Invitrogen) and A431 was cultured in DMEM (Invitrogen). Both media were supplemented with 10% fetal bovine serum (FBS). During the culture, the media were changed every other day. The cells were passaged every 5–6 days using Trypsin-EDTA (0.25% trypsin, 1mM EDTA). To lyse the cells, they were washed 2X with cold PBS followed by the addition of 1 mL of cold lysis buffer (50 mM HEPES, 150 mM NaCl, 1.5 mM MgCl2, 1 mM EDTA, 100 mM NaF, 10 mM sodium pyrophosphate, 1% Triton X-100, 10% glycerol) supplemented with 1X protease inhibitor cocktail, 1 mM phenylmethylsulfonyl fluoride, and 1 mM activated sodium orthovanadate was added to each cell flask. The cells were incubated on ice for 15 min with occasional swirling then removed from the plate with a cell scraper and transferred to a microcentrifuge tube. The cell lysate was then clarified by centrifuging at 14,000 g at 4°C for 15 min. Total protein concentration was determined using a BCA protein assay kit (Pierce, Rockford, IL) and the lysates were stored at −80°C until further use.
In vitro solution phase kinase activity assay
100 µg of MDA-MB-468 cell lysate was incubated with 8 µL of 1 mM ATP, 5 µL of 100 µg/mL EGF, 33.3 µL of 3X EGFR kinase assay buffer, with or without 100 ng of GST-Eps15 and water (total volume of 100 µL) for 2 hr at room temperature. Protein (cell lysate) concentration in the reaction mixture was 1 µg/µL. At the end of the reaction, GST-Eps15 was immunoprecipitated by using either monoclonal rabbit anti-Eps15 antibody (Santa Cruz Biotechnologies) or 4G10 anti-phosphotyrosine antibody (Upstate Biotech). For this purpose, the reaction mixture was incubated with the above mentioned antibodies overnight at 4°C. 100 µL of protein G beads (Pierce, Rockford, IL) was then added to the mixture and incubated for 2 hr at room temperature with gentle mixing. Immunoprecipitated protein was then eluted and analyzed by SDS- PAGE and western blotting using anti-phosphotyrosine and anti-Eps15 as the primary antibodies.
Fabrication of hydrogel based protein arrays
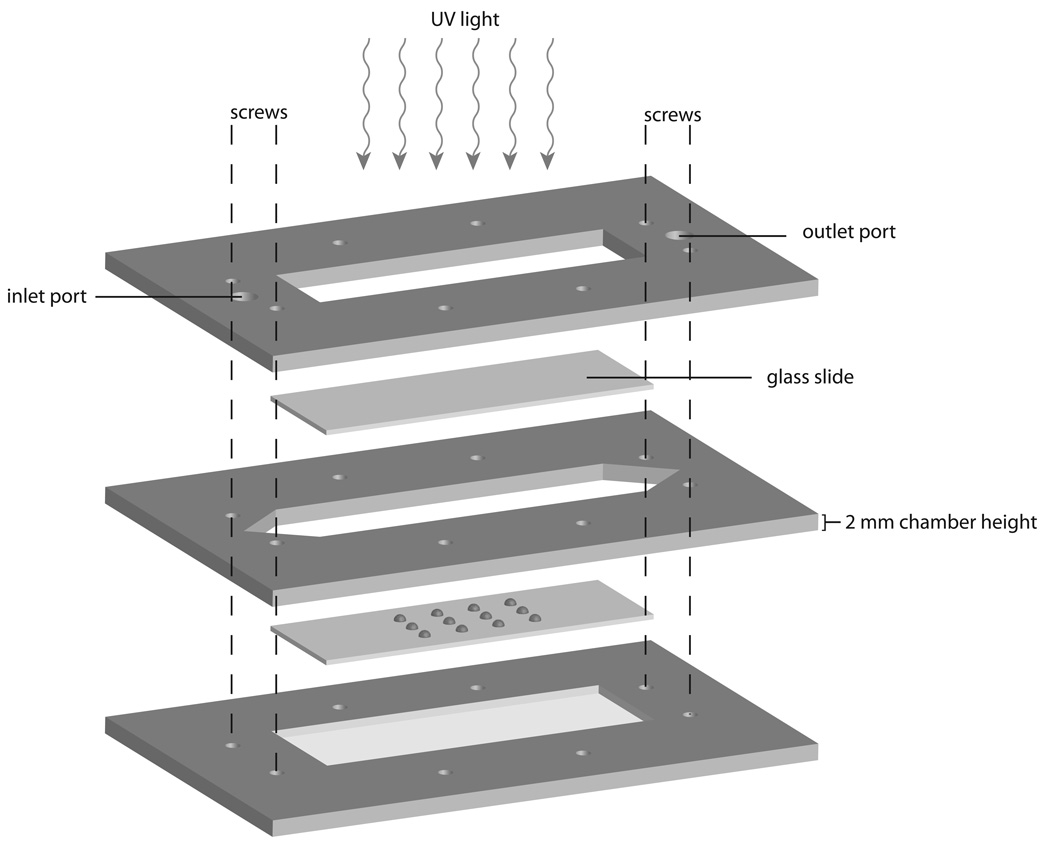
Glass slides were acryl-functionalized and substrate (GST-Eps15) was acryl labeled as described previously [16, 24]. To fabricate the protein arrays, acryl labeled GST-Eps15 was immobilized on the functionalized glass slides by copolymerization with polyacrylamide in a free-radical polymerization. 1 µL protein spots were created by depositing an aqueous protein mixture containing 4% (w/v) acrylamide/bisacrylamide, 0.1% (w/v) Irgacure-2959 (Ciba Specialty Chemicals), 15% (w/v) glycerol, and 0–700 ng of GST-Eps15 onto the glass slides via micropipette. The slide containing spotted prepolymer was then enclosed in a custom chamber (Figure 1) and purged with nitrogen. The custom-fabricated polymerization chamber consists of 2 mm thick acrylic plates sealed together with six screws. The slide with the prepolymer spots fits in a recess on the bottom plate. The cut-out center of the middle plate forms the walls of the channel while the cut-out recess in the top plate allows a glass slide to form the top of the chamber and permits UV light transmission. Tubing connectors are attached to the ports on the top slide which allow nitrogen to be purged through the chamber. After purging, the tubing is sealed to maintain the nitrogen environment, and the chamber is immediately exposed to UV light to initiate polymerization. The chamber was placed in a UV oven and polymerized by UV (365 nm) illumination at 1500 µW/cm2 for 15 min. The glass slide containing the polymerized array was removed from the chamber and washed in TBST (10 mM Tris-HCl, 100 mM NaCl and 0.15% Tween-20) and then in DI water prior to storing in 1X EGFR kinase buffer (20 mM HEPES pH:7.2, 10 mM MnCl2, 1 mM DTT, 15 mM MgCl2 and 40 µg/mL BSA) at 4°C.
Figure 1.
The custom-fabricated polymerization chamber consists of acrylic sheets sealed together with six screws. The slide with the prepolymer spots fits in the recess on the bottom plate. The cut-out center of the middle plate forms the walls of the channel while the cut-out recess in the top plate allows a glass slide to form the top of the chamber and permits UV light transmission. Tubing connectors are attached to the ports on the top slide to allow nitrogen to be purged through the chamber.
Array based kinase assay
To carry out the kinase assay, the kinase buffer was aspirated from the slides and the slides were dried under a stream of compressed air. Reaction chambers were created by placing 3.5×0.5 cm spacers, made from Dura Lar sheets of 350µm thickness, at the both end of the slides (for 1200 µL reactions) or between the spots (for 60 µL reactions) and placing a clean glass slide over the spots.
Optimizing Parameters
To optimize the substrate protein concentration and the reaction time, the reaction time was varied from 15 min to 2 hr and the substrate concentrations were varied from 0–700 ng/spot. The reaction mixture consisting of 950 µg of MDA-MB-468 cell lysate, 100 µL of 1 mM ATP, 50 µL of 100 µg/mL EGF, 400 µL of 3X EGFR kinase assay buffer, 200 µL of 50% glycerol and water (total volume of 1200 µL) was then applied to the reaction chamber. Protein (cell lysate) concentration was 0.8 µg/µL of reaction mixture. To optimize protein (cell lysate) concentration, 25–75 µg of cell lysate was used in 60 µL reaction mixture so that the final concentration varied from 0.4 to 1.25 µg/µL.
Comparing the effects of inhibitors on EGFR kinase activity
Tyrosine kinase inhibitors AG 1478, AG 1296, and genistein (Calbiochem), at concentrations varying from 0–500 µM, were preincubated with cell lysates for 30 min at room temperature prior to performing the kinase assay.
Detection and quantification of phosphorylated substrates
After the reaction, the slides were washed with TBST for 30 min. Then the slides were blocked in TBST containing 1% BSA for 1 hr at room temperature. This was followed by incubation of the slides with 4G10 anti-phosphotyrosine (Upstate Biotech) antibody for 1 hr at room temperature. After incubation with primary antibody, the slides were washed 3X with TBST then incubated with horseradish peroxidase (HRP) conjugated goat anti-mouse secondary antibody (Invitrogen). Enhanced chemiluminescence (ECL) technique was used to detect HRP activity. After development of the film, average pixel value of each spot and the background signal in the near vicinity was measured using Image J software (NIH, Bethesda, MD) and the difference between the two signals was reported as the pixel value for the spot.
Cell viability assay
MDA-MB-468 cells were seeded at a density of 5 X 10³ cells/well in 96 well plates. After 24 hr, AG 1478 at varying concentrations was added and the cells were incubated further for 48 hr. The cells were then washed with phosphate buffered saline (PBS) and cell viability was measured using a XTT assay kit (Sigma, St. Louis, MO).
Western blot analysis
MDA-MB-468, MDA-MB-453, A431, and NCI-H23 cells were harvested and cellular protein concentration was quantified using a BCA protein assay (Pierce, Rockford, IL). 25 µg of protein was subjected to 10% SDS-polyacrylamide gel electrophoresis and transferred to nitrocellulose membranes. After blocking the membranes with 0.1% BSA in TBST for 1 hr at room temperature, the membranes were probed with primary anti-EGFR antibody (Santa Cruz Biotechnologies) and horseradish peroxidase-conjugated secondary antibody respectively for 1 hr at room temperature. Protein levels were detected by ECL (Pierce).
Flow Cytometry
MDA-MB-468 and MDA-MB-453 cells (2 X 10⁵) were fixed in 1% paraformaldehyde for 10 min at 37°C and then incubated overnight with anti-EGFR antibody (1:500 in PBS with 2% FBS and 0.1% NaN3) at 4°C. After 30 min of secondary stain with Alexa 488 anti-rabbit IgG secondary antibody, cells were analyzed on a FACSCalibur flow cytometer. Control samples were incubated with only secondary antibody.
Quantitative Reverse Transcription – Polymerase Chain Reaction
RNA from MDA-MB-468 and K562 cells was extracted using an RNeasy Mini kit (Qiagen, Valencia, CA) and cDNA was generated using Omniscript reverse transcriptase (Qiagen), 1 µg of RNA, and oligo(dT) primers. qPCR was conducted using a Quantitect SYBER Green PCR kit (Qiagen), 1 µL of cDNA and 0.5 µL of 20 µM primers on an iCycler (Bio-Rad, Hercules, CA). Relative expression levels of EGFR were calculated using the ΔCT method and normalizing to glyceraldehyde-3-phosphate dehydrogenase transcription.
Results
In vitro solution phase kinase activity assay
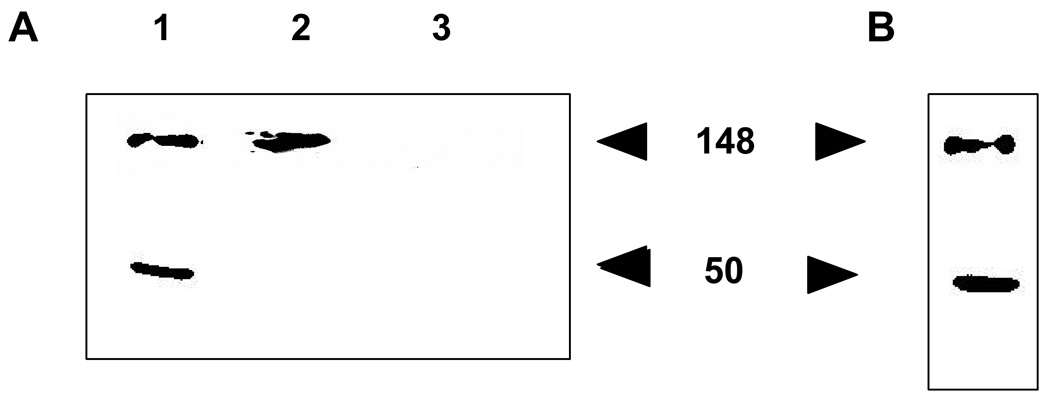
To investigate the ability of GST-Eps15 to act as a substrate for quantifying EGFR kinase activity in vitro, we assessed the phosphorylation of a GST-Eps15 construct in MDA-MB-468 cell lysate. Following the incubation of GST-Eps15 construct with cell lysate for 2 hr, the substrate was immunoprecipitated with rabbit anti-Eps15. To determine whether the substrate had been phosphorylated, the immunoprecipitate was analyzed via western blotting with a primary mouse anti-phosphotyrosine antibody. Two bands corresponding to phosphorylated Eps15 were detected (Figure 2A, lane 1). The band at 148 kDa is consistent with endogenous Eps15 while the one at 50 kDa corresponds to GST-Eps15. To ensure that the band at 148 kDa corresponds to endogenous Eps15, the same experiment was carried out in a reaction lacking the GST-Eps15 construct. As can be seen, only one band appeared at 148 kDa (Figure 2A, lane 2).
Figure 2.
In vitro kinase assay: To determine the ability of GST-EPS15 to act as an EGFR substrate, MDA-MB-468 cell lysate was incubated with (lane 1) or without (lane 2) GST-Eps15 for 2 hr. The experiment was also carried out in the absence of cell lysate (lane 3). Eps15 was then immunoprecipitated with anti-Eps15 and the protein was then analyzed by SDS PAGE/western blotting with a mouse anti-phosphotyrosine antibody (A). Upon incubation of MDA-MB-468 lysate with GST-Eps15 for 2 hr, proteins were immunoprecipitated with anti-phosphotyrosine antibody and immunoblotted with rabbit anti-Eps15 (B). The bands at 148 kDa indicate the phosphorylation of endogenous Eps15 whereas the bands at 50 kDa indicate the phosphorylation of GST-Eps15.
When the reaction was performed in the absence of cell lysate, no bands appeared (Figure 2A, lane 3). To further confirm substrate phosphorylation, following the kinase reaction proteins were immunoprecipitated with a mouse antiphosphotyrosine antibody. The immunoprecipitate was then analyzed via western blot using a rabbit anti-Eps15 antibody. Again, we observed two bands (Figure 2B), suggesting phosphorylation of endogenous Eps15 and GST-Eps15.
Array based kinase assay
Optimization
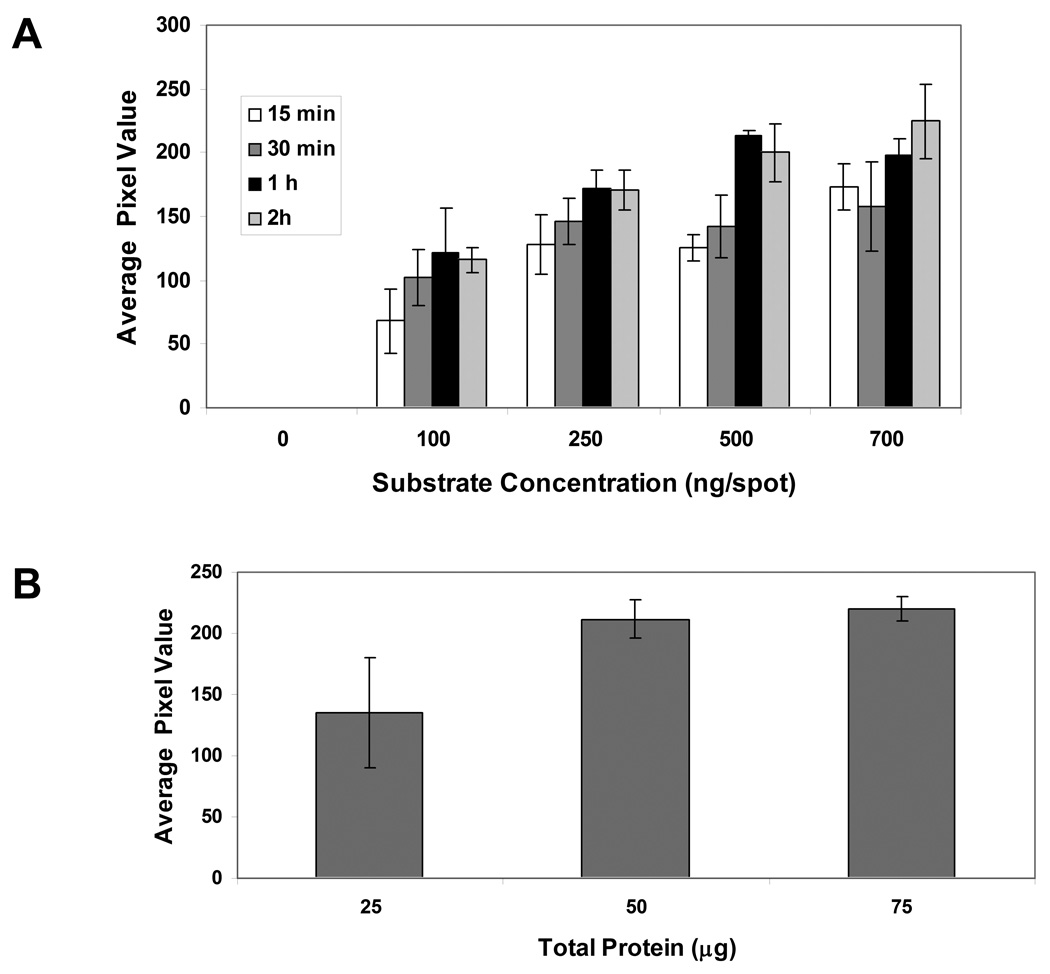
Initial hydrogel array-based studies were directed towards optimizing the reaction time and GST-Eps15 concentration. The reaction time was varied from 15 min to 2 hr while the substrate concentration ranged from 0–700 ng/spot. Figure 3A illustrates the phosphorylation of the GST-Eps15 substrate by MDA-MB-468 cell lysate at these conditions, using an anti-phosphotyrosine antibody followed by ECL detection as readout. As expected, substrate phosphorylation increased with increasing reaction time. The phosphorylation signal saturated by 1 hr for all substrate concentrations. Increasing the substrate concentration also resulted in an increase in detected substrate phosphorylation. Since significantly high phosphorylation of the substrate was observed at 500 ng/spot, all the further experiments were performed at this substrate concentration with 1 hr incubation in cell lysate.
Figure 3.
Optimization of reaction time, substrate concentration, and total protein in MDA-MB-468 cell lysate. (A): Reaction time and substrate concentration was varied to determine the effect of MDA-MB-468 cell lysate on GST-Eps15 phosphorylation. Extent of GST-Eps15 phosphorylation was quantified by ECL and is presented as the pixel value. Each data point represents the mean of three independent experiments in which each experiment contained four replicates of each sample, and the error bars represent s.e.m. (n=3). (B): 25- 75 µg cell lysate was incubated with GST-Eps15 (500 ng/spot) for 1 hr. Extent of GST-Eps15 phosphorylation was quantified by ECL and is presented as the pixel value Each data point represents the mean of three replicates and the error bars represent s.e.m.
To optimize the total amount of protein in the reaction mixture, experiments were performed using 25 to 75 µg cell lysate. As illustrated in Figure 3B, increasing the total protein from 25 to 50 µg enhanced substrate phosphorylation significantly (p < 0.05). However, a further increase in cell lysate amount did not increase GST-Eps15 phosphorylation significantly, indicating 50 µg cell lysate was sufficient to phosphorylate the substrate in 1 hr.
Determining specificity of GST-Eps15 phosphorylation
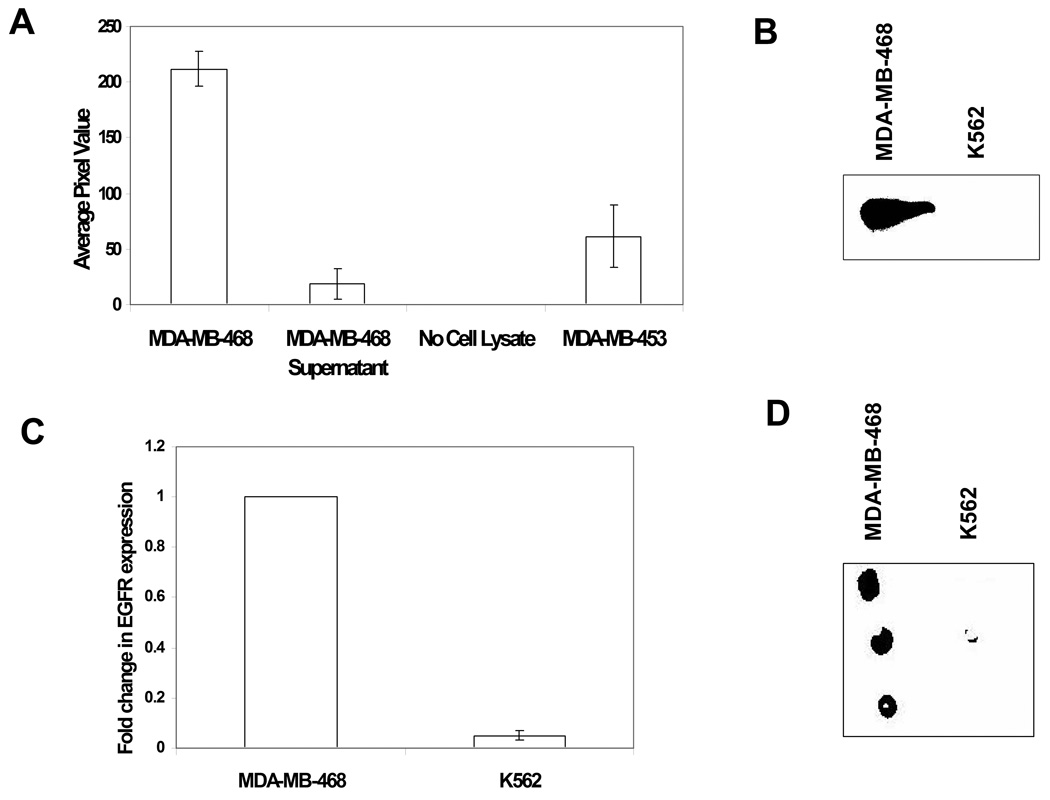
Extracts from MDA-MB-468 cells contain multiple tyrosine kinases in addition to EGFR; these kinases may potentially contribute to phosphorylation of immobilized Eps15. To address whether other components of the cell lysate phosphorylate Eps15, experiments were conducted using cell lysates of MDA-MB-468 (expressing high levels of EGFR), MDA-MB-453 (low level of EGFR), the supernatant of MDA-MB-468 immunodepleted of EGFR, and a no lysate control. A high level of Eps15 phosphorylation (ECL value of 211 ± 16) was observed in presence of MDA-MB-468, and phosphorylation of GST-Eps15 was substantially lower (ECL value: 61 ± 27) when immobilized Eps15 was incubated with MDA-MB-453 (Figure 4A). MDA-MB-468 immunodepleted with anti-EGFR antibody resulted in very little phosphorylation of immobilized Eps15 (ECL value: 15.4 ±12), indicating that kinases other than EGFR contribute very little to the phosphorylation of the GST-Eps15 substrate. No phosphorylation of the Eps15 was observed in the absence of cell lysate, as expected.
Figure 4.
Specificity of immobilized Eps15 phosphorylation by EGFR. (A) Cell lysates of MDA-MB-468, MDA-MB-453, and the supernatant of MDA-MB-468 after EGFR immunodepletion were assayed for EGFR activity. ECL values represent the phosphorylation of GST-Eps15. Each data point represents the mean of three independent replicates from each of three independent experiments, and the error bars represent s.e.m. (B) EGFR protein levels in MDA-MB-468 and K562 cell lysates were determined using SDS PAGE/western blot technique. (C) Quantitative PCR was used to determine the RNA transcript levels of EGFR in MDA-MB-468 and K562 cells. Fold change expression was normalized to expression in MDA-MB-468 cells. (D) Typical image of phosphorylation of GST-Eps15 after incubation with MDA-MB-468 and K562 cell lysates for 1 hr. While incubation with MDA-MB-468 cell lysates resulted in phosphorylation of the protein spots, incubation with K562 cell lysates resulted in very little phosphorylation.
To confirm further that phosphorylation of GST-Eps15 is primarily due to EGFR in the cell lysates, GST-Eps15 arrays were incubated with K562 as well as MDA-MB-468 cell lysates. K562 cells, a human chronic myeloid leukemia cell line that expresses very high levels of the constitutively active tyrosine kinase Bcr-Abl, but is known to lack EGFR expression [25]. Expression of EGFR genes and proteins in K562 was verified by qPCR and western blot analyses. As shown in Figure 4B and 4C, virtually no expression of EGFR was observed in K562 cells. When the protein array was incubated with K562 as well as MDA-MB-468 cell lysates virtually no phosphorylation of GST-Eps15 was observed (Figure 4D).
Determining the detection limit of the array
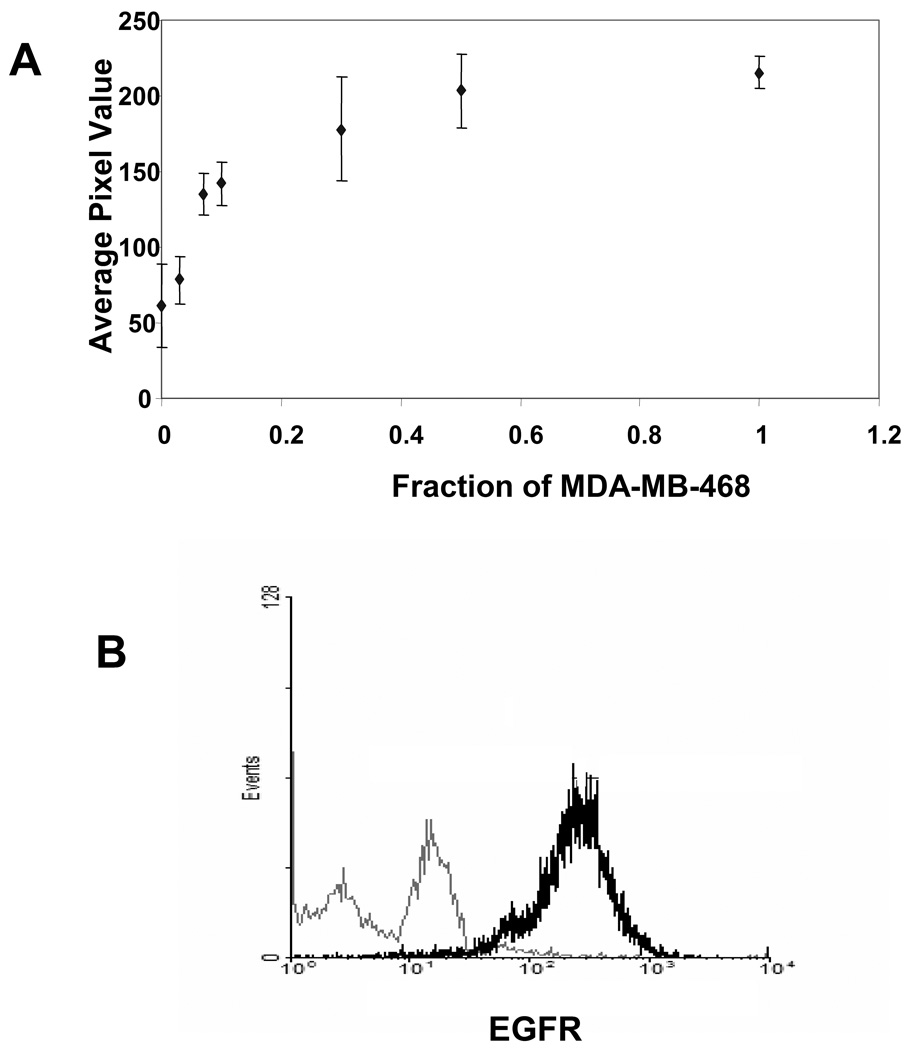
To estimate the detection limit of the hydrogel based protein array, MDA-MB-468 cell lysate was diluted into MDA-MB-453 cell lysate. This simulates identification of a population of cells that overexpress EGFR in the background of cells with a lower, but nonzero, level of EGFR expression. Arrays containing 500 ng of GSTEps15 per spot were incubated for 1 hr with 50 µg of cell lysate, 0–100% from MDA-MB-468 and the remaining from MDA-MB-453. As demonstrated in Figure 5A, GST-Eps15 phosphorylation increased upon increasing the fraction of MDA-MB-468 in the reaction mixture. A statistically significant difference in substrate phosphorylation was observed (p < 0.05) when the protein array was incubated with a reaction mixture containing 7% MDA-MB-468 cell lysate. Relative cell surface EGFR levels in MDA-MB-468 and MDA-MB-453 cells were measured by flow cytometry. As shown in Figure 5B, a substantially higher mean fluorescent intensity of 240 was obtained for MDA-MB-468 as compared to 5.1 for MDA-MB-453, indicating a significant difference in EGFR expression between the two cell lines.
Figure 5.
(A) Detection limit of the hydrogel-based protein array for EGFR activity. MDA-MB-468 cell lysate was diluted in MDA-MB-453 cell lysate. The mixtures contained a total 50 µg of cell lysate, 0–100% from MDA-MB-468 and the remaining from MDA-MB-453. Each data point represents the mean of three independent experiments in which each experiment contained three replicates. The error bars represent s.e.m. (n=3). (B) Relative expression of cell surface EGFR in MDA-MB-468 and MDA-MB-453 cell lines. Flow cytometric analysis demonstrated significantly lower EGFR expression in MDA-MB-453 (grey) as compared to MDA-MB-468 (black) cells.
Comparing the effects of inhibitors on EGFR kinase activity
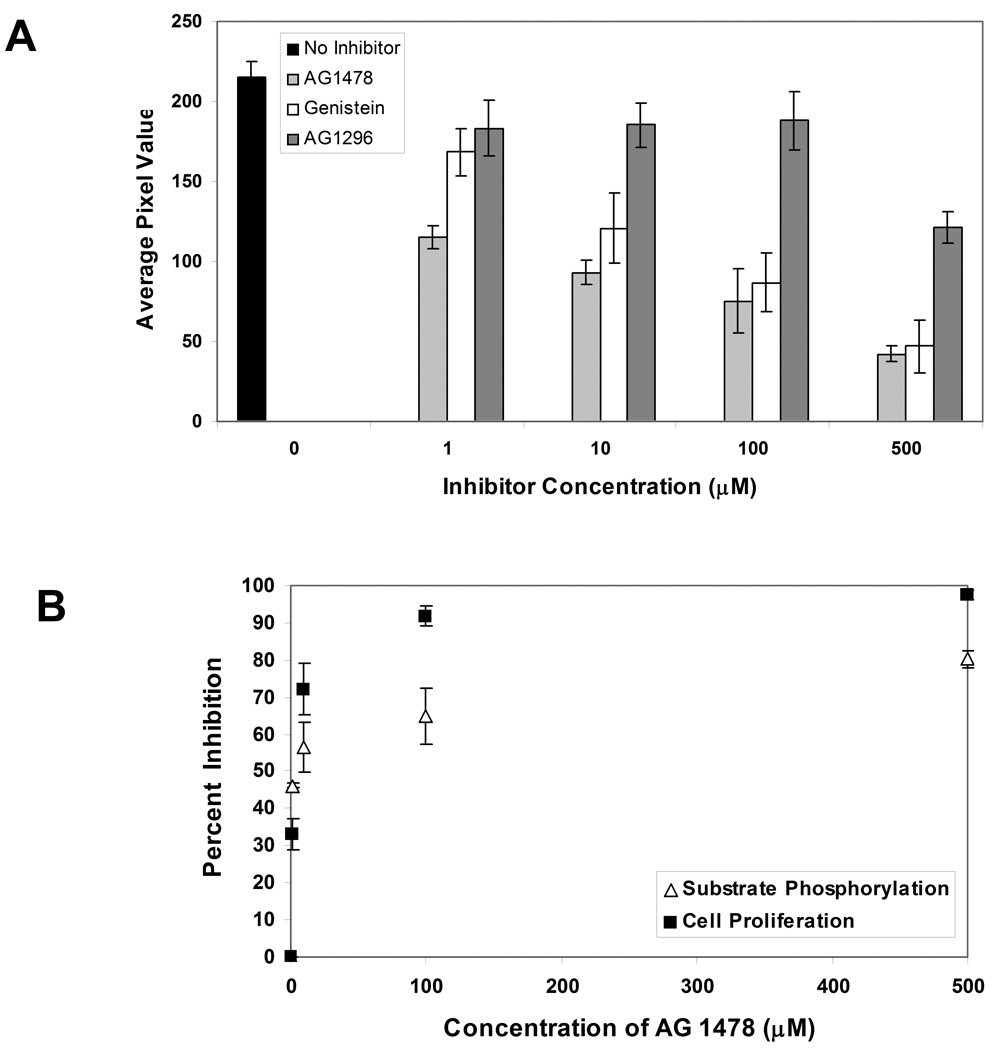
After confirming the ability of the GST-Eps15 array to quantitatively measure EGFR activity from cellular extracts, experiments were performed to demonstrate its ability to screen inhibitors of EGFR kinase activity. For this purpose, the protein arrays were incubated for 1 hr with reaction mixtures containing MDA-MB-468 cell lysate in the presence of different inhibitors. The inhibitors utilized include AG 1478 (a specific EGFR inhibitor), AG 1296 (a specific PDGFR inhibitor), and genistein (a nonspecific tyrosine kinase inhibitor) [26]. The concentrations of these ATP-competitive inhibitors were varied from 0 to 500 µM. Figure 6A demonstrates a dose dependant effect of the inhibitors on substrate phosphorylation. Incubation of MDA-MB-468 cell lysate with AG 1478 resulted in significant inhibition of EGFR kinase activity, leading to attenuated substrate phosphorylation (IC50 ~ 2.5 µM). Incubation with genistein also significantly inhibited substrate phosphorylation albeit at a higher inhibitor concentration (IC50 < 100 µM). Even though a prior study reported phosphorylation of Eps15 by PDGF receptor [19], when MDA-MB-468 cell lysate was incubated with AG 1296, no significant inhibition of EGFR kinase activity was observed (IC50 > 500 µM), suggesting that the phosphorylation of immobilized GST-Eps15 construct is not due to PDGFR. Our observation is consistent with another study which also did not observe Eps15 phosphorylation upon PDGFR activation [27].
Figure 6.
Comparison of the effects of different inhibitors (AG 1478, AG 1296, and Genistein) on the phosphorylation of immobilized GST-Eps15 by MDA-MB-468 cell lysate. The concentration of each inhibitor ranged from 0–500 µM. Each data point represents the mean of three independent experiments in which each experiment contained three replicates. The error bars represent s.e.m. (n=3). (B) Comparison of MDA-MB-468 cell viability with immobilized GST-Eps15 phosphorylation by MDA-MB-468 cell lysate after treatment with varying concentrations of AG 1478. Each data point represents the mean of three independent experiments, expressed as percent inhibition of cell growth or substrate phosphorylation.
Experiments were then performed to examine the effect of AG 1478 on proliferation of MDA-MB-468 cells. As shown in Figure 6B, AG 1478 induced a dose dependant growth inhibition of the cells with IC50~ 2.7µM. When the effects of AG 1478 on cell viability and substrate phosphorylation were compared, a similar trend was observed (Figure 6B).
Comparing EGFR activity in different cancer cell lysates
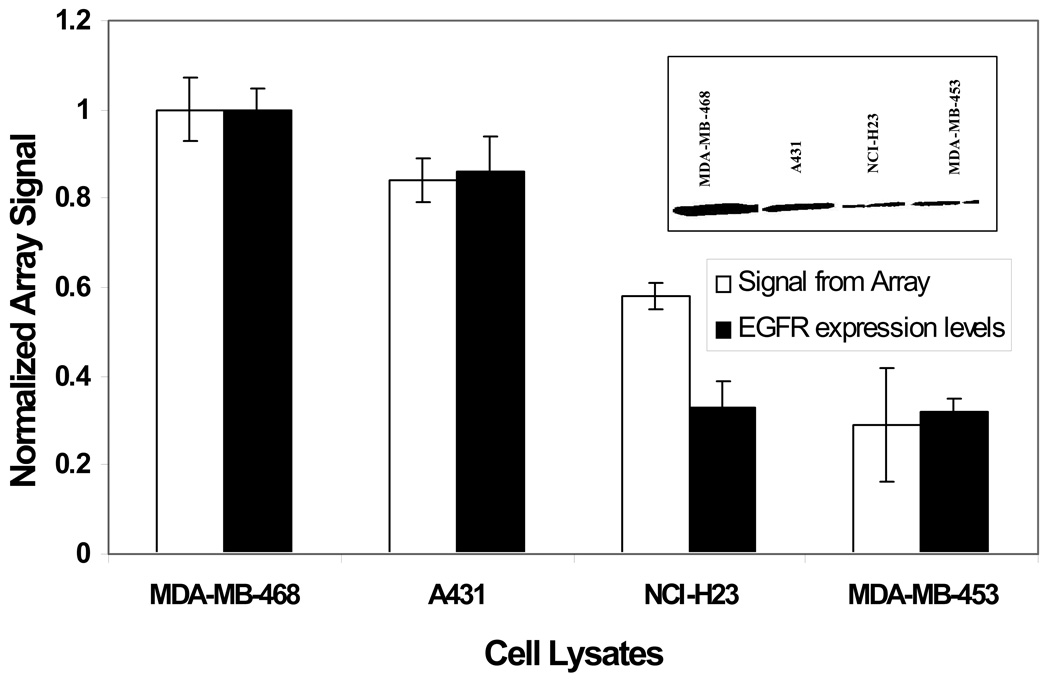
Experiments described above demonstrate the ability of GST-Eps15 array to quantitatively measure EGFR activity from MDA-MB-468 cell lysate and to identify inhibitors of EGFR kinase activity. Since EGFR is overexpressed in many solid tumors, we next assessed the ability of the protein array to quantify EGFR activity in the cellular extracts from different carcinogenic origins. The cell lines investigated were A431 (an epidermoid carcinoma cell line expressing higher level of EGFR) and NCI-H23 (a lung cancer cell line with low EGFR expression). Figure 7 compares substrate phosphorylation with EGFR expression for the different cell lines, normalized to MDA-MB-468. The inset shows EGFR expression levels in all the four cell lines. When incubated with MDA-MB- 468 and A431, high levels of substrate phosphorylation, and thus higher kinase activities, were observed. However, incubating with NCI-H23 resulted in low substrate phosphorylation, signifying lower EGFR activity. The signals thus obtained from cells expressing lower levels of EGFR (ECL value: 61 ± 27 and 120 ± 6 for MDA-MB-453 and NCI-H23) were significantly lower than those from cells overexpressing EGFR (ECL value: 211 ± 16 and 177 ± 11 for MDA-MB-468 and A431; p < 0.05).
Figure 7.
Comparison of immobilized GST-Eps15 phosphorylation with EGFR expression in different cancer cell lines. Each data point represents the mean of three independent experiments normalized with respect to MDA-MB-468 cell lysate and the error bars represent s.e.m. The inset shows a representative western Blot analysis of EGFR expression in the cell lysates.
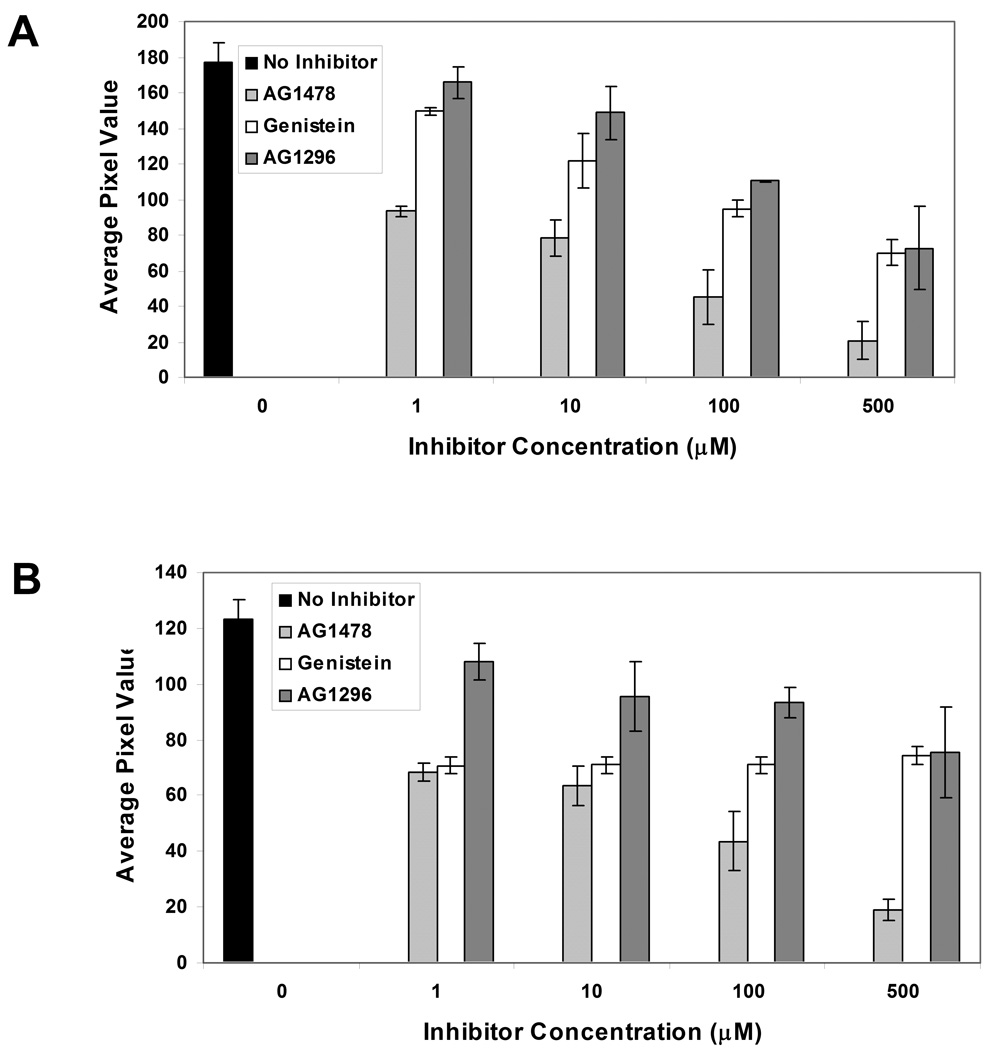
To investigate the effects of different inhibitors on EGFR kinase activity in A431 and NCI-H23 cell lysates, the dose dependence of these inhibitors on substrate phosphorylation was studied. Figure 8A demonstrates the effect of inhibitors on EGFR kinase activity in A431 cell lysates. Significant attenuation of substrate phosphorylation (p < 0.05) was observed upon incubation of A431 cell lysates with 1 µM AG1478 and 10 µM genistein. Similarly, as shown in Figure 8B, upon incubation of NCI-H23 cell lysates with 1 µM AG1478 and 1 µM genistein, EGFR kinase activity decreased significantly (p < 0.05). However, increasing the concentration of genistein further did not reduce the substrate phosphorylation. AG1296 had the least effect on EGFR activity in both cell lines; substrate phosphorylation was attenuated significantly only when a concentration of 100 µM was used.
Figure 8.
Comparison of the effects of different inhibitors (AG 1478, AG 1296 and Genistein) on the phosphorylation of immobilized GST-Eps15 by (A) A431 and (B) NCI-H23 cell lysates. The concentration of each inhibitor ranged from 0–500 µM. Each data point represents the mean of three independent experiments in which each experiment contained three replicates of each data point. Error bars represent s.e.m. (n=3).
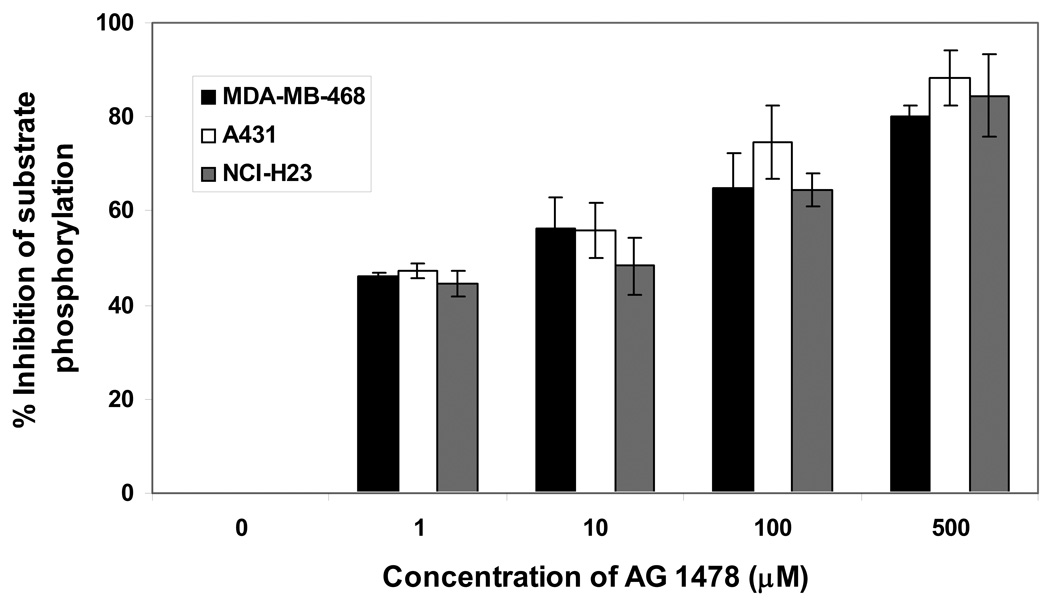
Figure 9 illustrates the percent inhibition of substrate phosphorylation when MDA-MB-468, A431, and NCI-H23 cell lysates were incubated with different concentrations of EGFR kinase specific inhibitor, AG 1478. IC50 values are provided in Table 1.
Figure 9.
MDA-MB-468, A431, and NCI-H23 lysates were assayed for EGFR activity in the presence and absence of EGFR inhibitor (AG1478). Percent inhibition of substrate phosphorylation was determined as a function of inhibitor concentration.
Table 1.
Table 1: IC50 of AG1478 (µM): Percent inhibition was plotted against the logarithmic concentration of the AG1478. Dose response curve was then fitted to determine IC50.
| MDA-MB-468 | 2.5 |
| A431 | 2.2 |
| NCI-H23 | 10.9 |
Discussion
Gene amplification, mutation, and/or overexpression of EGFR can result in enhanced tyrosine kinase activity which in turn correlates with growth and progression of several cancers. The potential of EGFR-targeted cancer treatments has prompted the development of therapeutics against EGFR. However, many of these drugs either have failed to reproduce the results in clinical settings as compared to the preclinical models or have only been effective in a subset of cancer patients. This inconsistency in expected outcome may be due to inappropriate drug dosage, drug resistance resulting from the development of a secondary mutation during the therapy, or development of an EGFR-independent escape mechanism for cancer cell survival. One way to address this problem is to develop a customized targeted treatment that evaluates EGFR kinase activity in tumors and predicts the effect of EGFR targeted therapeutics on individual patients. Currently, a variety of techniques are employed to quantify EGFR at DNA, RNA, and protein levels. At the protein level, EGFR expression is typically evaluated using immunohistochemistry (IHC), western analysis, or enzyme immunoassay (EIA) [28–30]. While these methods may be able to assess EGFR expression level in a biopsy sample, they are unable to quantify the kinase activity. Moreover, IHC, which is the most commonly-used technique, suffers from lack of quantitative information. At the RNA transcript level, EGFR can be quantified using Northern analysis or reverse transcription–polymerase chain reaction (RT-PCR). However, mRNA concentration may not directly correlate to protein concentration or activity. DNA analysis through quantitative PCR methods can detect gene amplification, mutation or deletion events, but it also does not measure the tyrosine kinase activity.
In this study we report the development of a hydrogel-based GST-Eps15 substrate array capable of measuring EGFR kinase activity in vitro. Since enhanced tyrosine kinase activity of EGFR in cancer is not only due to overexpression of EGFR but may also be due to activating mutations, gene amplification, or increased ligand binding [28], the assay reported in this study may provide a more accurate report of the disease state than the conventional methods which quantify EGFR mRNA or protein abundance. Moreover, even though in vitro and in vivo studies have demonstrated the ability of different anti-EGFR agents to inhibit processes involved in tumor growth and maintenance, no significant influence had been observed on the level of EGFR expression [12, 14]. This further bolsters the necessity of an assay that quantifies the cellular response to anti-EGFR therapies and thus acts as a predictive tool for patient prognosis or response to treatment.
To develop an assay to quantify EGFR activity in a cell lysate, acryl-labeled GST-Eps15 was attached to the functionalized glass slides by copolymerization with acrylamide in a free-radical polymerization. Previous studies from our lab have shown that immobilization of fusion protein constructs within a three dimensional polyacrylamide hydrogel facilitates maintenance of native form of the protein by maintaining a hydrated microenvironment around the substrate as well as reducing the hydrophobic interactions between the glass and the protein, which in turn yields improved sensitivity (16, 24). Moreover, functionalization of the slides reduces non specific protein binding (16, 24). We used GST-Eps15 acrylamide copolymer system to detect EGFR kinase activity in the lysates from cells of different carcinogenic origin as well as with different levels of EGFR expression. Further, we have also demonstrated the ability of this assay to detect the inhibition of kinase activity by studying the effect of different inhibitors.
Studies have reported that even though patients with activating mutations have shown positive responses to anti-EGFR therapies, development of secondary mutations has led to drug resistance (31–33). Since development of drug resistance will lead to enhanced instead of attenuated signal from the protein array, by analyzing the biopsy lysates, we believe this assay system may be able to identify the development of any drug resistance. Moreover, recent studies have demonstrated that administration of alternative EGFR inhibitors may overcome the resistance due to acquired mutations in some cases [32–34]. One study showed that while switching to erlotinib overcame gefitinib resistance in a NSCLC patient with L858R+L747S mutation, it failed for a gefitinib refractory patient with T790M mutation [34]. Similarly another report demonstrated the switch from erlotinib to gefitinib yielded a positive response in a lung adenocarcinoma patient with L858R+E884K mutation [33]. Therefore, in addition to detection of drug resistance, this assay may also be able to predict whether switching EGFR inhibitors will be beneficial for a particular patient.
Acknowledgements
We thank Dr. Christian Metallo for providing the human embryonic stem cell cDNA and Samira Azarin for assistance with the flow cytometry. Funding for this work was provided by grant R01GM074691 from National Institutes of Health.
Footnotes
Publisher's Disclaimer: This is a PDF file of an unedited manuscript that has been accepted for publication. As a service to our customers we are providing this early version of the manuscript. The manuscript will undergo copyediting, typesetting, and review of the resulting proof before it is published in its final citable form. Please note that during the production process errors may be discovered which could affect the content, and all legal disclaimers that apply to the journal pertain.
References
- 1.Boyle P, Levin B, editors. World Cancer Report, International Agency for research on Cancer, Lyon. 2008. [Google Scholar]
- 2.Madhusudan S, Ganesan TS. Tyrosine kinase inhibitors in cancer therapy. Clin Biochem. 2004;37:618–635. doi: 10.1016/j.clinbiochem.2004.05.006. [DOI] [PubMed] [Google Scholar]
- 3.Laskin JJ, Sandler AB. Epidermal growth factor receptor: a promising target in solid tumors. Cancer Treat Rev. 2004;30:1–17. doi: 10.1016/j.ctrv.2003.10.002. [DOI] [PubMed] [Google Scholar]
- 4.Yarden Y. The EGFR family and its ligands in human cancer: signaling mechanisms and therapeutic opportunities. Eur J Can. 2001;37:S3–S8. doi: 10.1016/s0959-8049(01)00230-1. [DOI] [PubMed] [Google Scholar]
- 5.Vlahovic G, Crawford J. Activation of tyrosine kinases in cancer. The Oncologist. 2003;8:531–538. doi: 10.1634/theoncologist.8-6-531. [DOI] [PubMed] [Google Scholar]
- 6.Brabender J, Danenberg KD, Metzger R, Schneider PM, Park JM, Salonga D, Holscher AH, Danenberg PV. Epidermal growth factor receptor and HER2-neu mRNA expression in non-small cell lung cancer is correlated with survival. Clin Cancer Res. 2001;7:1850–1855. [PubMed] [Google Scholar]
- 7.Kobayashi S, Boggon TJ, Dayaram T, Janne PA, Kocher O, Meyerson M, Johnson BE, Eck MJ, Tenen DG, Halmos B. EGFR mutation and resistance of non-small-cell lung cancer to gefitinib. N Engl J Med. 2005;352:786–792. doi: 10.1056/NEJMoa044238. [DOI] [PubMed] [Google Scholar]
- 8.Pao W, Miller VA, Politi KA, Riely GJ, Somwar R, Zakowski MF, Kris MG, Varmus H. Acquired resistance of lung adenocarcinomas to gefitinib or erlotinib is associated with a second mutation in the EGFR kinase domain. PLoS Med. 2005;2:1–11. doi: 10.1371/journal.pmed.0020073. [DOI] [PMC free article] [PubMed] [Google Scholar]
- 9.Wosikowski K, Schuurhuis D, Kops GJ, Saceda M, Bates SE. Altered gene expression in drug-resistant human breast cancer cells. Clin Cancer Res. 1997;3:2405–2414. [PubMed] [Google Scholar]
- 10.Selvaggi G, Novello S, Torri V, Leonardo E, De Giuli P, Borasio P, Mossetti C, Ardissone F, Lausi P, Scagliotti GV. Epidermal growth factor overexpression correlates with poor prognosis in completely resected non small cell lung cancer. Annals of Oncology. 2004;15:28–32. doi: 10.1093/annonc/mdh011. [DOI] [PubMed] [Google Scholar]
- 11.Nicholson RI, Gee JMW, Harper ME. EGFR and cancer prognosis. Eur J Can. 2001;37:9–15. doi: 10.1016/s0959-8049(01)00231-3. [DOI] [PubMed] [Google Scholar]
- 12.Baselga J. Why the Epidermal growth factor receptor? The rationale for cancer therapy. The Oncologists. 2002;7:2–8. doi: 10.1634/theoncologist.7-suppl_4-2. [DOI] [PubMed] [Google Scholar]
- 13.Ohsaki Y, Tanno S, Fujita Y, Toyoshima E, Fujiuchi S, Nishigaki Y, Ishida S, Nagase A, Miyokawa N, Hirata S, Kikuchi K. Epidermal growth factor receptor expression correlates with poor prognosis in non-small cell lung cancer patients with p53 overexpression. Oncol Rep. 2000;7:603–607. doi: 10.3892/or.7.3.603. [DOI] [PubMed] [Google Scholar]
- 14.Mendelsohn J, Baselga J. EGF receptor family as targets for cancer therapy. Oncogene. 2000;19:6550–6565. doi: 10.1038/sj.onc.1204082. [DOI] [PubMed] [Google Scholar]
- 15.Kris MG, Natale RB, Herbst RS, Lynch TJ, Jr, Prager D, Belani CP, Schiller JH, Kelly K, Spiridonidis H, Sandler A, Albain KS, Cella D, Wolf MK, Averbuch SD, Ochs JJ, Kay AC. Efficacy of Gefitinib, an inhibitor of epidermal growth factor receptor tyrosine kinase, in symptomatic patients with non small cell lung cancer. JAMA. 2003;290:2149–2158. doi: 10.1001/jama.290.16.2149. [DOI] [PubMed] [Google Scholar]
- 16.Brueggemeier SB, Stephen DW, Kron SJ, Palecek SP. Protein-acrylamide copolymer hydrogels for array –based detection of tyrosine kinase activity from cell lysates. Biomacromolecules. 2005;6:2765–2775. doi: 10.1021/bm050257v. [DOI] [PubMed] [Google Scholar]
- 17.Lynch TJ, Bell DW, Sordella R, Gurubhagavatula S, Okimoto RA, Brannigan BW, Harris PL, Haserlat SM, Supko JG, Haluska FG, Louis DN, Christiani DC, Settleman J, Haber DA. Activating mutations in the epidermal growth factor receptor underlying responsiveness of non small cell lung cancer to Gefitinib. N Engl J Med. 2004;350:2129–2139. doi: 10.1056/NEJMoa040938. [DOI] [PubMed] [Google Scholar]
- 18.Lee JW, Soung YH, Kim SY, Nam HY, Park WS, Nam SW, Kim MS, Sun D, Lee YS, Jang JJ, Lee JY, Yoo NJ, Lee SH. Somatic mutations of EGFR gene in squamous cell carcinoma of the head and neck. Clin Cancer Res. 2004;11:2879–2882. doi: 10.1158/1078-0432.CCR-04-2029. [DOI] [PubMed] [Google Scholar]
- 19.Fazioli F, Minichiello L, Matoskova B, Wong WT, di Fiore PP. eps15, a novel tyrosine kinase substrate, exhibits transforming activity. Mol Cell Biol. 1993;13:5814–5828. doi: 10.1128/mcb.13.9.5814. [DOI] [PMC free article] [PubMed] [Google Scholar]
- 20.Carbone R, Fre S, Iannolo G, Belleudi F, Mancini P, Pelicci PG, Torrisi MR, di Fiorre PP. Eps15 and Eps15R are essential components of the endocytic pathway. Cancer Res. 1997;57:5498–5504. [PubMed] [Google Scholar]
- 21.Benmarah A, Lamaze C, Begue B, Schmid SL, Dautry-Varsat A, Cerf-Bensussan N. AP-2/Eps15 interaction is required for receptor-mediated endocytosis. J Cell Biol. 1998;140:1055–1062. doi: 10.1083/jcb.140.5.1055. [DOI] [PMC free article] [PubMed] [Google Scholar]
- 22.Benmarah A, Poupon V, Cerf-Bensussan N, Dautry-Varsat A. Mapping of Eps15 domains involved in its targeting to clarithin coated pits. J Biol Chem. 2000;275:3288–3295. doi: 10.1074/jbc.275.5.3288. [DOI] [PubMed] [Google Scholar]
- 23.Confalonieri S, Salcini AE, Puri C, Tacchetti C, di Fiore PP. Tyrosine phosphorylation of Eps15 is required for ligand-regulated, but not constitutive, endocytosis. J Cell Biol. 2000;150:905–911. doi: 10.1083/jcb.150.4.905. [DOI] [PMC free article] [PubMed] [Google Scholar]
- 24.Brueggemeier SB, Kron SJ, Palecek SP. Use of protein-acrylamide copolymer hydrogels for measuring protein concentration and activity. Anal Biochem. 2004;329:180–189. doi: 10.1016/j.ab.2004.02.012. [DOI] [PubMed] [Google Scholar]
- 25.Naruse I, Ohmori T, Ao Y, Fukumoto H, Kuroki T, Mori M, Saijo N, Nishio K. Antitumor activity of the selective epidermal growth factor receptor tyrosine kinase inhibitor (EGFR-TKI) Iressa® (ZD1839) in an EGFR expressing multidrug resistant cell line in vitro and in vivo. Int J. Cancer. 2002;98:310–315. doi: 10.1002/ijc.10173. [DOI] [PubMed] [Google Scholar]
- 26.Akiyama T, Ishida J, Nakagawa S, Ogawara H, Watanabe S, Itoh N, Shibuya M, Fukami Y. Genistein, a specific inhibitor of tyrosine-specific protein kinases. J Cell Biol. 1987;262:5592–5595. [PubMed] [Google Scholar]
- 27.van Delft S, Schumacher C, Hage W, Verkleij AJ, van Bergen en Henegouwen PMP. Association and colocalization of Eps15 with adoptor protein-2 and clarithin. J Cell Biol. 1997;136:811–821. doi: 10.1083/jcb.136.4.811. [DOI] [PMC free article] [PubMed] [Google Scholar]
- 28.Arteaga CL. Epidermal growth factor receptor dependence in human tumors: more than just expression? The Oncologist. 2002;7:31–39. doi: 10.1634/theoncologist.7-suppl_4-31. [DOI] [PubMed] [Google Scholar]
- 29.Mandic R, Eikelkamp N, Peldszus R, Sadowski M, Sesterhenn AM, Dunne AA, Werener JA. Variations of EGF-R expression in squamous cell carcinoma of head and neck region. AntiCancer Res. 2001;21:3413–3418. [PubMed] [Google Scholar]
- 30.Kumar RR, Meenakshi A, Sivakumar N. Enzyme immunoassay of human epidermal growth factor (hEGFR) Hum Antibodies. 2001;10:143–147. [PubMed] [Google Scholar]
- 31.Kobayashi S, Boggon TJ, Dayaram T, Janne PA, Kocher O, Meyerson M, Johnson BE, Eck MJ, Tenen DG, Halmos B. EGFR mutation and resistance of non small cell lung cancer to gefitinib. N Engl J Med. 2005;352:786–792. doi: 10.1056/NEJMoa044238. [DOI] [PubMed] [Google Scholar]
- 32.Kobayashi S, Ji H, Yuza Y, Meyerson M, Wong K-K, Tenen DG, Halmos B. An alternative inhibitor overcomes resistance caused by a mutation of epidermal growth factor receptor. Cancer Res. 2005;65:7096–7101. doi: 10.1158/0008-5472.CAN-05-1346. [DOI] [PubMed] [Google Scholar]
- 33.Costa DB, Schumer ST, Tenen DG, Kobayashi S. Differential responses to erlotinib in epidermal growth factor receptor (EGFR)-mutated lung cancers with acquired resistance to gefitinib carrying L747S or T790M secondary mutations. J Clin Oncol. 2008;26:1182–1184. doi: 10.1200/JCO.2007.14.9039. [DOI] [PubMed] [Google Scholar]
- 34.Choong NW, Dietrich S, Seiwert TY, Tretiakova MS, Nallasura V, Davies GC, Lipkowitz S, Husain AN, Salgia R, Ma PC. Gefitinib response of erlotinib-refractory lung cancer involving meninges-role of EGFR mutation. Nat Clin Pract Oncol. 2006;3:50–57. doi: 10.1038/ncponc0400. [DOI] [PubMed] [Google Scholar]


