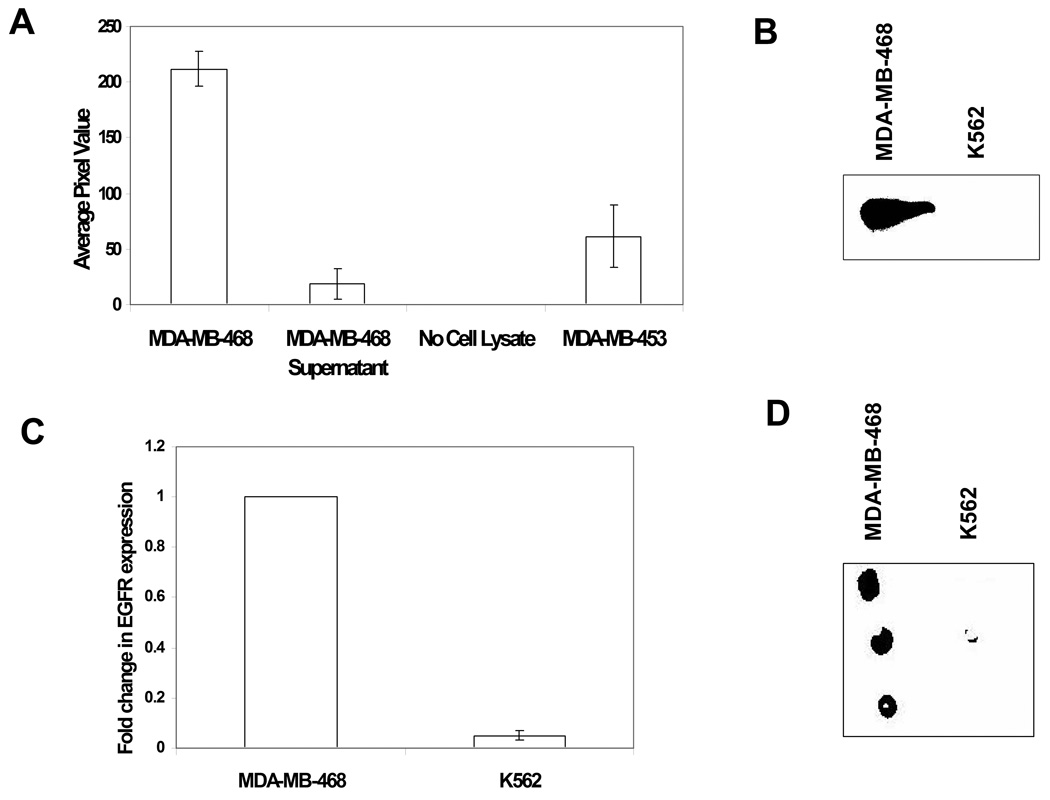
Figure 4.
Specificity of immobilized Eps15 phosphorylation by EGFR. (A) Cell lysates of MDA-MB-468, MDA-MB-453, and the supernatant of MDA-MB-468 after EGFR immunodepletion were assayed for EGFR activity. ECL values represent the phosphorylation of GST-Eps15. Each data point represents the mean of three independent replicates from each of three independent experiments, and the error bars represent s.e.m. (B) EGFR protein levels in MDA-MB-468 and K562 cell lysates were determined using SDS PAGE/western blot technique. (C) Quantitative PCR was used to determine the RNA transcript levels of EGFR in MDA-MB-468 and K562 cells. Fold change expression was normalized to expression in MDA-MB-468 cells. (D) Typical image of phosphorylation of GST-Eps15 after incubation with MDA-MB-468 and K562 cell lysates for 1 hr. While incubation with MDA-MB-468 cell lysates resulted in phosphorylation of the protein spots, incubation with K562 cell lysates resulted in very little phosphorylation.

