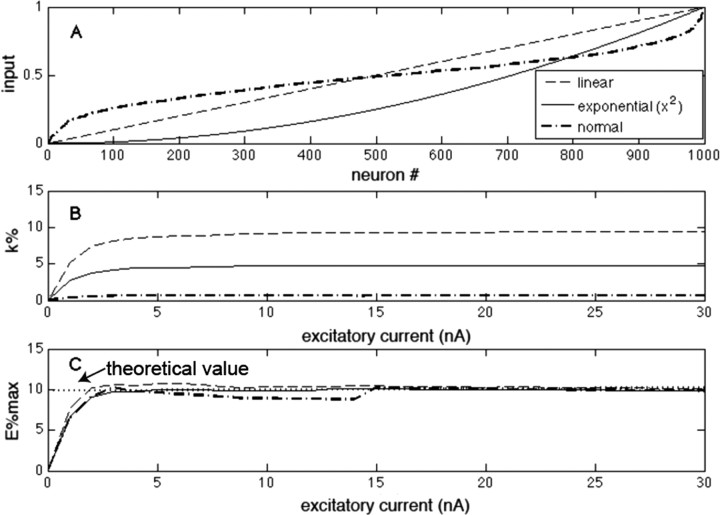
Figure 2.
Comparison of a k-winner-take-all description with an E%-max winner-take-all description. A, Graph of the input excitation of 1000 different neurons in the network. The minimum excitation is always zero, and the values are relative to the cell with maximal excitation (excitatory current). Neurons here are ranked in terms of increasing excitation. Several distributions are plotted (same legend for A–C). B, The number of winners (k%) as excitation is scaled up. C, E%-max as excitation is scaled up. The dotted line in C indicates the theoretical value derived in Results.

